Saad Ullah

Shiba Inu was never built on fundamentals. It was built on momentum, memes, and the kind of collective optimism that only exists at the peak of a bull cycle. When that cycle ended, SHIB had nowhere to hide - and the chart has been honest about it ever since. A 93% drop from the all-time high is not a correction. It is a full reset, and the market is still working through what comes after.
From a Vertical Rally to a Structural Breakdown
Shiba Inu reached its peak near $0.00008616 during the speculative frenzy of 2021, then began a slide that has not reversed. Analyst Carl Hawley puts the total drawdown at roughly 93% from that all-time high - a figure that captures just how fast speculative enthusiasm can unwind once the tide goes out.
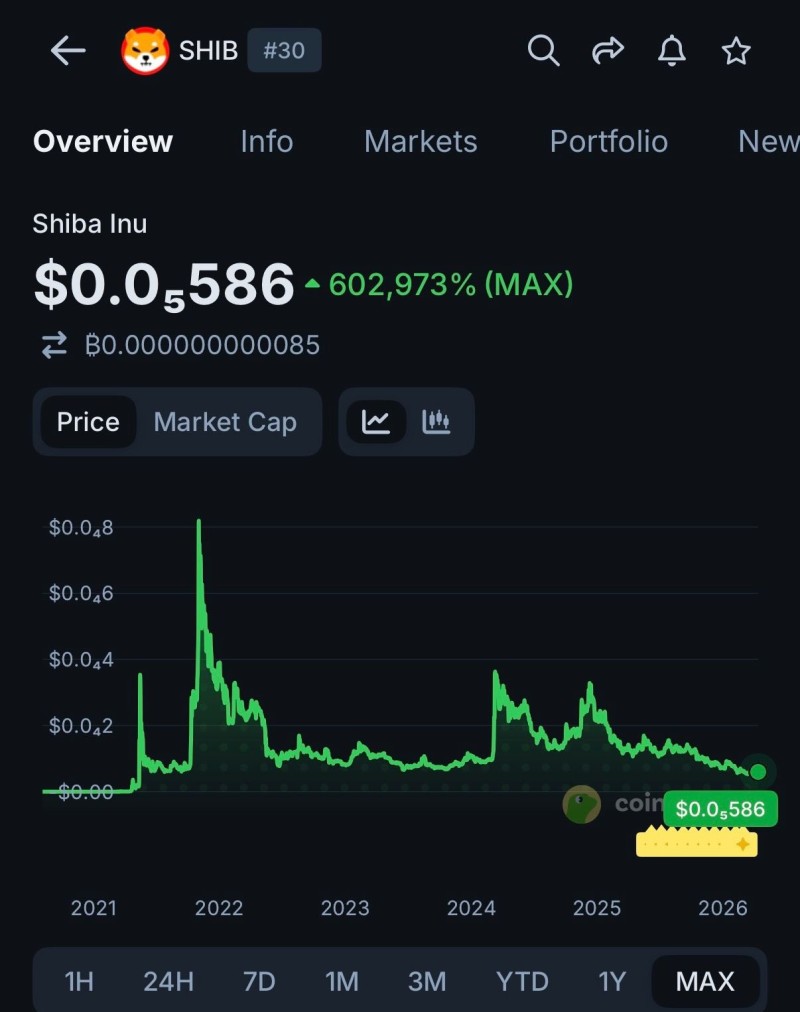
The 2021 move itself was textbook blow-off behavior: a near-vertical price spike followed by an immediate and decisive reversal. Since that peak, SHIB has never come close to revisiting it. Every rally has stalled below the prior one, confirming that the burst of momentum that defined that cycle has been fully spent.
A Multi-Year Pattern of Weak SHIB Recoveries
After the initial collapse, SHIB moved into a long consolidation phase that looked like stability on the surface but was structurally weak underneath. The price action over multiple cycles has shown the same pattern playing out again and again.
Key features of this phase include:
- Repeated lower highs across each recovery attempt
- Short-lived bounces that fade before reaching prior resistance
- No sustained breakout above any meaningful level
SHIB continues forming lower highs and remains under key resistance zones, with no sign of a structural reversal taking hold.
The 2024 rebound was the latest example. It gained traction briefly, then stalled well below earlier peaks. As covered in SHIB price prediction: sideways trading expected to continue, the broader expectation for the token has been range-bound movement rather than meaningful recovery - and the chart has delivered exactly that.
SHIB Support Zone Holds - But Shows Cracks
In the current range, SHIB is trading near a long-established support area between $0.000005 and $0.000006. This zone has drawn buyers in past cycles and produced short-term rebounds - but each time price returns to test it, the floor loses a bit of its strength.
The behavior around this level gives a mixed picture. Buyers are present, but they are not in control. Bounces have lacked the kind of momentum needed to flip the trend, and Shiba Inu teeters on the edge of adding a zero to its price point - a scenario that becomes more plausible with each failed recovery attempt. The downward pressure has not lifted, and repeated tests of the same support level tend to wear it down over time.
What the price action shows near this zone:
- Buyers are present but not dominant
- Bounces lack consistent follow-through
- Downward pressure remains the default state
A SHIB Chart Defined by Lower Highs and Slow Compression
The bigger picture has not changed. SHIB continues to print lower highs and fails to establish higher lows, keeping the structure squarely in downtrend territory. The vertical collapse phase is over, but what has replaced it is not recovery - it is a slow compression near support, the kind of price behavior often seen as a major speculative cycle finishes unwinding.
Until SHIB breaks the pattern of lower highs, the chart continues to reflect a market where hype has faded and price is still searching for a new equilibrium.
This is not simply about one support level holding or breaking. The broader structure is what matters. As discussed in the SHIB price analysis: token tests support zone after rally, the conditions for a genuine trend reversal have not yet materialized. Until SHIB breaks the chain of lower highs that has defined it since 2021, the chart remains a map of a market where the hype cycle has run its course and real price discovery is still underway.
 Saad Ullah