 Usman Salis

Pepe (PEPE) is showing some mixed signals right now - while the meme coin has been hammered over the past six months, technical indicators suggest it might be oversold and ready for a bounce.
PEPE's Price Action Tells Two Different Stories
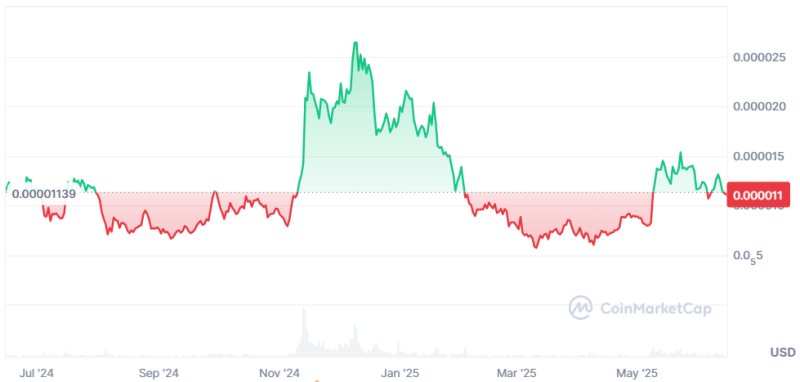
Let's be honest - Pepe (PEPE) has been through the wringer lately. Sure, it managed to eke out a tiny 0.56% gain this past week, but that's like putting a band-aid on a broken leg. When you zoom out to the monthly view, things get ugly fast with a brutal 25.88% drop that's got investors feeling pretty nervous.
But here's where it gets really painful - over the last six months, PEPE has absolutely cratered by 53.94%. That's the kind of decline that makes even the most diamond-handed meme coin enthusiasts start questioning their life choices. This massive selloff shows just how volatile these community-driven tokens can be when the hype train derails.
Technical Indicators Are Screaming "Oversold" for PEPE
Now here's where things get interesting. Despite all the doom and gloom, the charts are actually hinting that Pepe (PEPE) might be due for a comeback. The RSI has dropped to 27.78, which is below that magic 30 level where traders usually start getting excited about potential reversals. Basically, it's saying "hey, maybe we've sold this thing a bit too hard."
The Stochastic oscillator is backing this up big time, sitting at an extremely low 11.44. That's the kind of reading that makes contrarian traders start licking their lips. But hold your horses - the MACD is still flashing red at -0.0000004683, which means the bears aren't ready to throw in the towel just yet.
Where PEPE Goes From Here: The Key Levels Everyone's Watching
So what's next for Pepe (PEPE)? Well, the technical setup is pretty clear cut. Right now, the 10-day moving average at $0.00001108 is sitting below the 100-day average of $0.00001230, which is textbook bearish territory. Not exactly what bulls want to see.
If PEPE manages to get its act together, the first real test comes at $0.00001424 - that's about 22% higher from where we're sitting now. Break through that wall, and suddenly $0.00001682 starts looking achievable. But if the selling pressure keeps up, there's support waiting at $0.000009094, roughly 22% below current levels. Lose that, and we're probably heading down to test $0.000006517, where the real bargain hunters might finally show up to the party.
 Usman Salis


