 Eseandre Mordi

Meta Platforms is heading into a pivotal moment, with both technical signals and valuation metrics pointing toward mounting downside pressure. The stock now sits directly above a major structural gap that could determine where it goes next.
Price Action Shows Accelerating Weakness
The latest chart from TrendSpider analyst reveals that META's recent decline isn't just routine volatility. Several large downward candles have pushed the stock toward the top edge of an unfilled gap between $607 and $618. With META currently trading around $618.94, it's essentially resting right on this boundary.
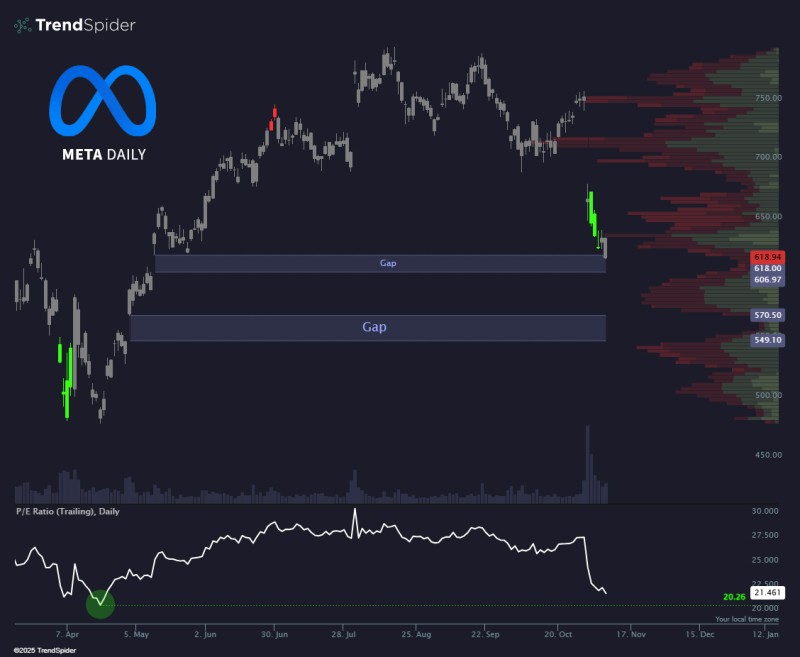
What stands out is the volume-at-price profile on the chart's right side. META has a heavy supply zone above where transaction density is high, but the region directly below shows a clear low-volume pocket. These thin zones historically act as "air pockets," making it more likely that price could slide through them quickly if support breaks.
The selling pressure is real, reflected in recent volume patterns where several declining sessions show increased trading activity. This isn't just low-liquidity noise — it's actual participation driving the move downward.
Valuation Compression Confirms the Technical Decline
One of the strongest signals is the rapid compression of META's trailing P/E ratio, which has fallen sharply toward around 20.26. This marks a notable shift from the mid-20s seen earlier in the year.
This decline suggests the market is recalibrating expectations around Meta's growth pace, profitability durability, or broader macro sensitivity. When valuation and price both move downward together rather than valuation providing a stabilizing floor, it often signals a deeper adjustment in investor sentiment. As the commentary notes, "both the chart and valuation are starting to agree," and this alignment makes the current technical levels even more important.
Key Technical Zones to Watch
- First Gap Support ($607–$618): META is currently touching the upper boundary of this zone. A decisive move below it could expose the stock to further downside.
- Lower Gap Target ($549–$570): The second gap provides the next meaningful support level. Given the low-volume area between the two gaps, a continuation toward this zone becomes more plausible if selling persists.
- Local Resistance Around $650: Any rebound faces immediate overhead resistance near the recent breakdown area.
Fundamental and Macro Context
Several factors may be influencing META's valuation pressure. Slowing ad spend recovery in certain global markets and intensifying competition in AI infrastructure and social platforms are weighing on sentiment. Higher-for-longer interest rate expectations continue to apply pressure to tech multiples, while shifts in user engagement between Meta's platforms, short-form rivalry, and regulatory scrutiny add complexity to the outlook. These elements contribute to the synchronized decline in both price and valuation visible on the chart.
 Eseandre Mordi


