 Peter Smith

⬤ Hyperliquid's native token HYPE is showing renewed volatility after pulling back from recent highs and returning toward a key technical support region. The chart shows a broader consolidation structure, including a clear head-and-shoulders pattern and repeated interactions with major price zones that have shaped recent market behavior.
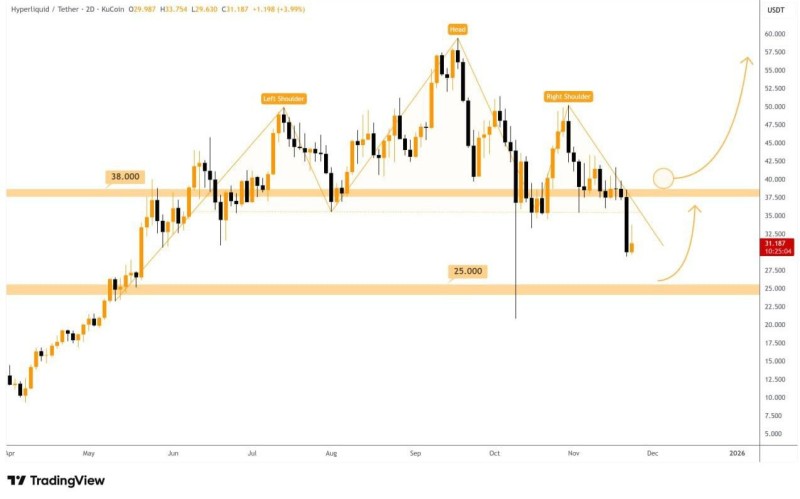
⬤ The chart reveals that HYPE formed a left shoulder earlier in the year, followed by a peak near the upper $50 range forming the head, and later a right shoulder beneath descending resistance. The breakdown from this pattern pushed price back into the highlighted $38 zone, which had acted as strong support multiple times. The recent move to the $31–$32 range reflects a deeper retracement, with a lower demand area near $25 also visible as a historical reaction level.
⬤ $HYPE remains below a descending trendline, meaning buyers must reclaim the $38 area before any structural shift can occur. Several potential recovery paths are visible if price manages to break through overhead resistance. Despite the pullback, the broader structure still leaves room for stabilization if buyers continue defending current levels.
⬤ This matters because HYPE is reacting consistently to well-defined technical levels, making these zones important markers for broader sentiment around Hyperliquid's token. Trading near a major support band positions the market at a pivotal moment where either a recovery attempt or a deeper retest may shape the next trend phase. How price reacts around the $38 resistance will likely guide expectations moving forward.
 Peter Smith


