 Saad Ullah

While the broader market continues to digest recent volatility, some traders are zeroing in on setups that suggest potential reversals. One standout is $HYPE, which appears to be completing an inverse Head & Shoulders pattern—a classic formation often seen before major upward moves.
Chart Analysis: The Pattern and Key Levels
Trader FZ, who's been tracking this setup closely, shared that he's already positioned long on $HYPE and plans to add more around the $40 mark, where the pattern's right shoulder is expected to take shape.
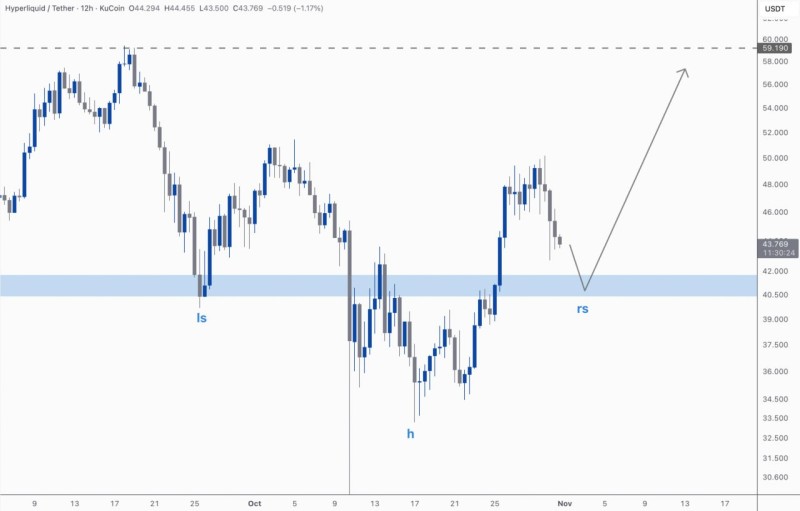
The 12-hour HYPE/USDT chart shows a clean inverse Head & Shoulders structure that suggests bullish momentum may return once confirmed:
- Left Shoulder (LS): Formed in late September around $41–$42 after a brief pullback
- Head (H): Created in mid-October with a deeper drop to $36–$37—the lowest point of the structure
- Right Shoulder (RS): Currently forming, with price pulling back toward the $40–$42 support zone (marked in blue on the chart)
This symmetric pattern indicates buyers are stepping in at each support retest, strengthening the setup's credibility.
Key Technical Levels:
- Support Zone: $40–$42 — where the right shoulder is forming and a potential entry point for traders
- Neckline Resistance: $46 — a breakout above this confirms the pattern and signals bullish control
- Price Target: Around $59, based on the pattern's height, representing roughly 35–40% upside from current levels near $42
The chart's projection suggests a sharp recovery toward $59 after a possible retest of the support zone. While volume isn't directly shown, the candle structure hints at rising volatility on upward moves and compression during pullbacks—typical behavior before a breakout.
Market Context and Outlook
The bullish setup on HYPE comes as traders rotate into mid-cap altcoins with strong technical bases, aided by Bitcoin's recent stability. The inverse H&S pattern fits this narrative perfectly—a potential trend reversal forming just as market sentiment improves.
All attention is now on the $46 neckline. A decisive close above this level could trigger a sustained move toward $59–$60, confirming the bullish scenario. However, if HYPE fails to hold $40 support, the pattern weakens and could lead to a retest of the $37 level.
For now, the technical bias leans bullish as the price continues to respect key support levels and pattern symmetry.
The inverse Head & Shoulders on HYPE's chart offers traders a straightforward game plan: as long as the token stays above $40, the setup remains valid with upside potential toward $59. With accumulation zones holding and momentum building, a breakout above $46 could confirm a major trend reversal—making HYPE one of the more compelling technical plays in today's altcoin market.
 Saad Ullah


