 Peter Smith

⬤HYPE is showing short-term weakness after a recent rally, now trading near $37.60 following rejection at the $39-$40 resistance zone. The chart points to a likely move toward $35.50, where price could find a base before attempting a new leg higher. This level lines up with prior consolidation areas and remains in focus for traders watching for a potential setup.
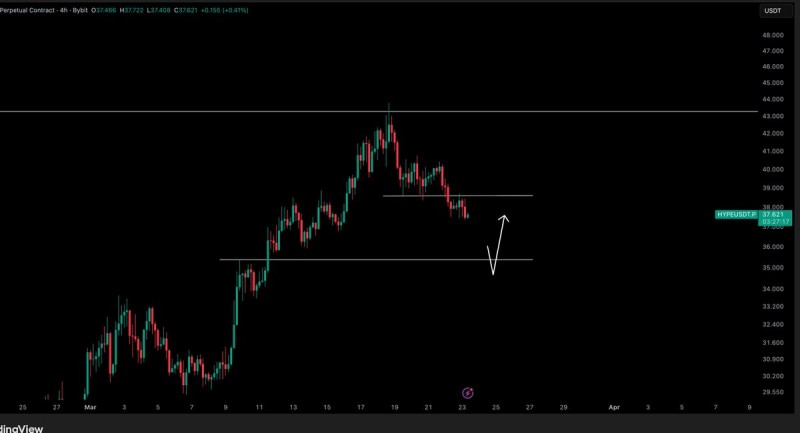
⬤After peaking near $42-$43, HYPE formed lower highs and shifted into a corrective structure. The current pullback targets the $35.50 support zone, which aligns with demand seen in earlier sessions. As covered in HYPE Price Analysis: $29.6 Support Holds Inside Downtrend Channel, $38 Breakout Needed, these reset phases are common before continuation moves develop.
⬤The price action also reflects liquidity-driven behavior, where markets tend to sweep key levels before reversing. A similar dynamic was outlined in HYPE Price Analysis: $38-$40 Liquidity Stack Points to $26 Sweep Before Rally, which flagged a lower-level sweep ahead of a rotation higher. The mid-$30 range has historically attracted buying interest, reinforcing why $35.50 carries weight here.
⬤HYPE is now at a critical juncture. If price holds $35.50 and builds a base, a recovery toward prior highs becomes plausible. A failure to stabilize at this level could extend the correction and shift near-term sentiment lower. The full breakdown of key demand zones is covered in HYPE Token: Key Support Levels to Watch After Pullback.
 Peter Smith


