Usman Salis

HYPE is at a crossroads. After weeks of grinding lower, the token staged a recovery from the $25 area - only to run into a wall of overhead resistance right where it hurts most. Momentum is already showing cracks, and the 2-hour Binance chart is painting a picture that bears are taking seriously. With a potential lower high forming near key Fibonacci levels and RSI divergence flashing warning signs, the next move could define HYPE's short-term direction.
RSI Divergence and the 3-Drive Setup Signal Weakening Momentum
The current price action fits a textbook three-drive pattern into the 2H downtrend line. HYPE pushed up toward the 0.618-0.75 Fibonacci retracement cluster near Monday's high - but that's where things got interesting. While price made a higher push, the RSI on the 2-hour chart quietly failed to confirm it, printing a lower peak. That kind of bearish divergence is often a first warning sign that buyers are running low on fuel.
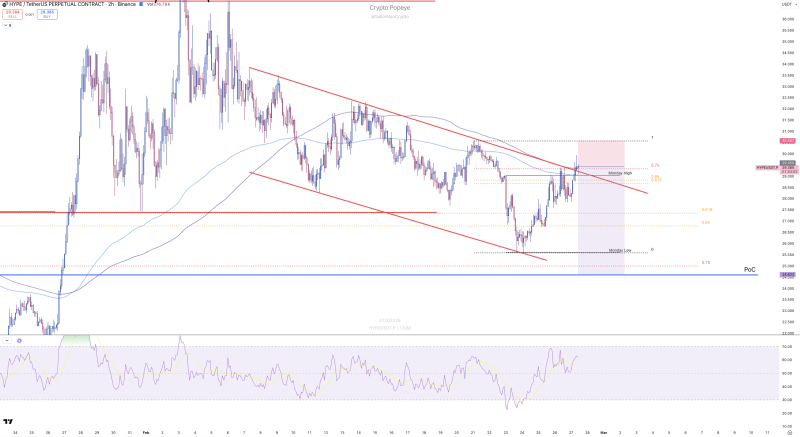
The upper $29 range is now acting as a ceiling, reinforced by the descending trendline that's been guiding the short-term trend. A lower high forming at this level would fit perfectly with the broader bearish structure already in place.
Descending Channel and Moving Averages Keep Bulls on the Back Foot
Zoom out slightly and the picture gets even cleaner. HYPE has been trading inside a well-defined descending channel, with the 50- and 200-period moving averages sitting overhead as additional dynamic resistance. Every rally attempt has been met with selling pressure somewhere near these levels, and this one appears no different so far.
The broader market structure strongly favors continued downside unless something changes. Analysts are watching closely for lower lows on shorter timeframes as confirmation. As prior analysis noted, the $38-$40 liquidity zone pointed to a potential sweep down to $26 - and that thesis hasn't been invalidated.
That said, there's a clear line in the sand. A decisive break above the descending trendline and recent swing highs would flip the script entirely, opening the door to a structural shift toward upside. Until that happens, the path of least resistance stays lower. The $22-$24 demand zone remains the obvious target on the downside if the bearish case plays out - a level worth watching for the next meaningful bounce attempt.
For now, HYPE sits at a pivotal junction. The convergence of trendline resistance, Fibonacci levels, and RSI divergence all point to a moment that could set the tone for HYPE - and potentially broader altcoin sentiment - over the near term.
Related Articles from TheTradable.com
 Usman Salis