Peter Smith

⬤ Holo's price action is getting interesting as HOT sits right at the bottom of a falling wedge pattern on the 2-day timeframe. The chart shows price squeezing tighter after a long downtrend, with recent candles holding steady just above a well-defined support zone. This structure hints that HOT might be gearing up for a breakout after months of downward pressure.
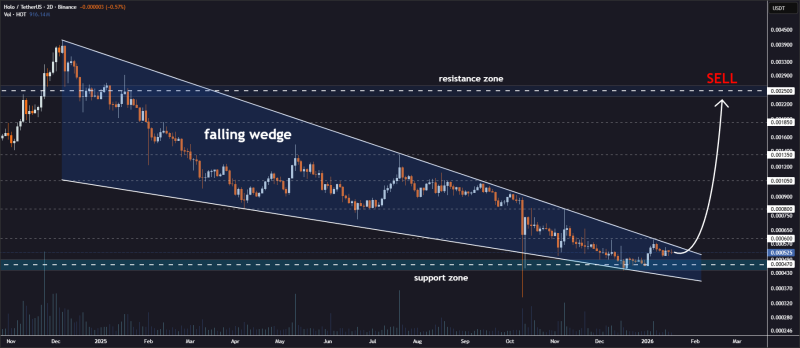
⬤ The falling wedge has been guiding price lower since late 2024, creating a classic pattern of lower highs and lower lows within tightening trendlines. Right now, HOT is holding near wedge support while resistance sits at the upper boundary. This kind of compression typically shows up when volatility drops before a market makes its next big move.
⬤ If a breakout happens, the chart maps out several upside targets: $0.00060, $0.00080, $0.00105, $0.00135, $0.00185, and $0.00250. These levels match up with previous resistance zones where price has reacted before, though there's no confirmed breakout yet.
⬤ Falling wedges often signal a shift from prolonged decline toward stabilization or reversal, making this setup worth watching. How HOT behaves near the wedge boundary could shape near-term sentiment and volatility. A confirmed breakout would flip the technical picture toward recovery mode, while rejection or breakdown would keep the broader downtrend intact and push any bullish move further down the road.
 Peter Smith