 Eseandre Mordi

⬤ Ethereum's daily chart shows price trapped in a downward-sloping corrective channel, with recent action clustering beneath the upper boundary and facing Fibonacci resistance around $3,350–$3,550. If momentum fades, possible downside zones sit below $2,700.
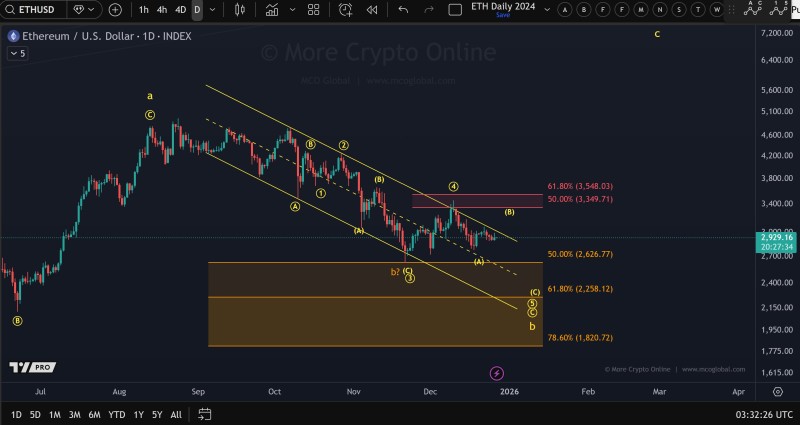
⬤ ETH has been stuck in sideways consolidation since weakness kicked in on November 21st, unable to break above the descending channel's upper limit. Currently hovering near $2,930, the price action looks more like range-bound consolidation than anything directional—traders are waiting for clear technical confirmation before betting on any sustained uptrend.
⬤ Technical analysts point out that even if ETH manages to punch through the channel, it might just be a corrective B-wave bounce rather than genuine bullish momentum. The $3,350–$3,550 zone represents major resistance, with $3,550 being the critical level needed to validate real upside potential. Until that breaks decisively, the outlook stays neutral at best.
⬤ There's still real downside risk if Ethereum can't build momentum soon. Fibonacci targets suggest potential drops to the $2,626–$2,258 range if selling pressure returns. Right now we're seeing consolidation—price bouncing around without establishing any clear direction—which fits the picture of ETH stuck below key resistance without confirmation of a broader reversal.
⬤ This matters for the whole crypto market since Ethereum essentially sets the tone for altcoin sentiment. As long as ETH stays pinned below resistance inside this corrective structure, expect traders to stay cautious, especially with riskier tokens. A clean break above $3,550 would change everything, but until that happens, consolidation or another leg down looks more likely.
 Eseandre Mordi


