 Usman Salis

⬤ Ethereum (ETH) is moving sideways on the daily chart, hanging around the $2,900 mark inside a demand zone that's been holding price action since late December into early 2025. The chart shows ETH/USDT trading near $2,935, with tight daily ranges showing there's not much momentum either way right now. Ethereum's still lagging Bitcoin and hasn't managed to push out a strong move from this support level yet.
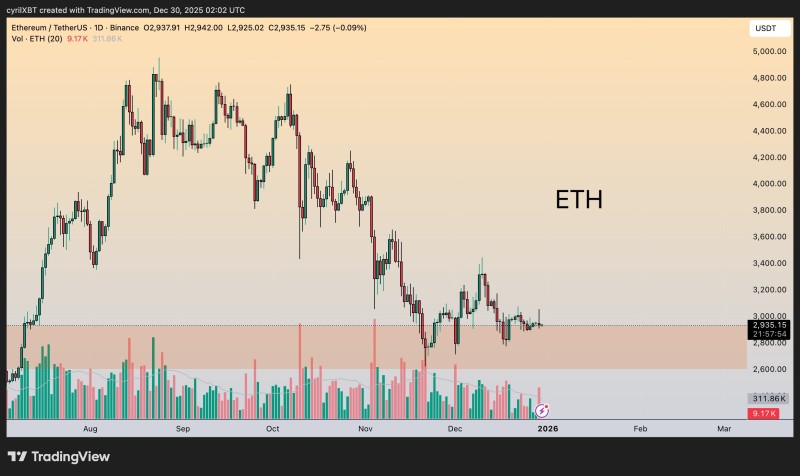
⬤ The demand zone covers roughly the mid to high $2,000 range, and Ethereum's been stuck in this area despite testing it multiple times. Volume bars at the bottom tell a clear story—trading activity is trending down, which means conviction is fading. This lines up perfectly with what we're seeing: volume dropping off and participation looking weaker while ETH stabilizes around the same support zone.
⬤ Here's something worth noting: ETH has a history of underperforming Bitcoin before eventually catching up and outperforming later. Right now, the structure looks more like consolidation than a breakdown. Price is building a base rather than dropping hard. The chart backs this up—mostly sideways action through December without big directional moves, which suggests ETH is holding steady rather than signaling any major trend shift just yet.
⬤ This matters because Ethereum is one of the biggest players in crypto, and when it consolidates near a key demand zone like this, it can become an important turning point. With ETH still trailing Bitcoin, volume fading, and price holding near $2.9K, the broader market sentiment is cautious. Everyone's waiting to see if this stabilization turns into renewed strength or just leads to more range-bound trading as we move through early 2025.
 Usman Salis


