Saad Ullah

⬤ Ethereum (ETH) is hanging on above the $3,000 mark, and according to recent technical analysis, we might be looking at a classic 1–2 wave pattern playing out. Support levels are holding steady so far, and there's a chance an internal third wave is starting to take shape. But here's the catch—while this is the working theory, the pattern isn't exactly textbook clean, which means it's still pretty fragile. When the chart was posted, ETH was hovering around $3,045.
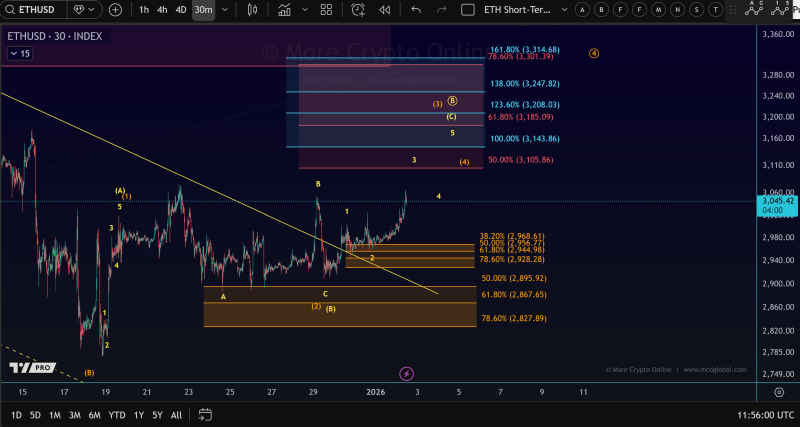
⬤ The 30-minute chart breaks down Ethereum's recent price action with multiple Fibonacci retracement and extension levels mapping out where support and resistance might kick in. Key support zones are clustered around $2,968, $2,957, $2,944, and $2,928, with deeper safety nets near $2,895 and $2,867 if things get rocky. On the flip side, if this third wave actually gains momentum, we're looking at potential upside targets ranging from about $3,105 all the way up to $3,314. The chart also shows ETH breaking through a downward trendline and starting to print higher short-term highs and lows, which is a positive sign for bulls.
⬤ Wave labels scattered across the chart suggest we might be shifting from a corrective phase into something more impulsive. There's a cluster of projected resistance zones sitting between roughly $3,143 and $3,314, which lines up with Fibonacci extensions ranging from 100% to 161.80%. Meanwhile, the support boxes indicate that even if ETH pulls back into the high $2,800s or low $2,900s, that would still be considered normal retracement territory for this pattern. The analysis comes with a warning though—despite the bullish potential, the structure isn't super clean because of overlapping waves and some messy price swings, so traders should stay cautious.
 Saad Ullah