 Marina Lyubimova

⬤ Ethereum is working through a corrective phase on the daily chart, with price action declining after failing to break through higher resistance. The chart shows a structured drop through late January, with recent candles pushing toward key Fibonacci levels around $2,250–$2,258, indicating the downside move isn't finished yet.
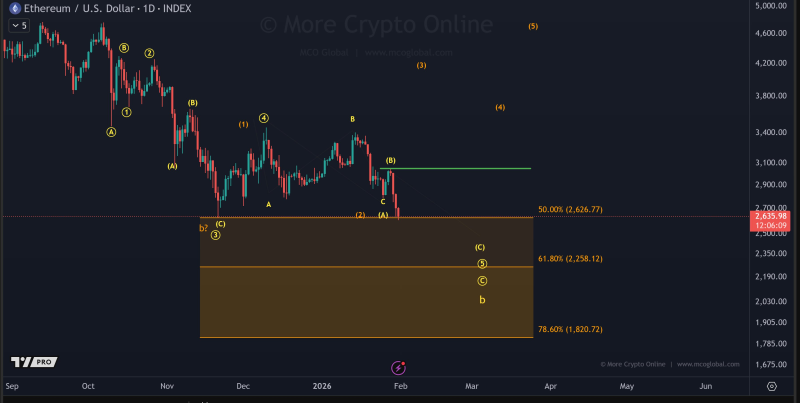
⬤ The current path matches expectations closely, with the leading scenario still calling for one more low before a larger recovery unfolds. Price recently traded near the 50% retracement at $2,626, suggesting there's room for additional downside toward the 61.8% Fibonacci zone at $2,258.
⬤ The chart also marks deeper levels including the 78.6% retracement near $1,820, outlining where the correction could end if selling extends further. So far, price action stays within this technical framework without signs of breakdown.
⬤ The decline looks orderly and contained within defined technical boundaries—no disorderly selling that would signal something worse. This suggests the move is corrective rather than a full trend reversal.
⬤ This setup matters across crypto because Ethereum often drives sentiment for the broader market. A completed correction near $2,250 followed by recovery would match current technical expectations and could lift sentiment across digital assets. Until then, watch how price behaves around these Fibonacci levels for clues on short-term direction.
 Marina Lyubimova


