Peter Smith

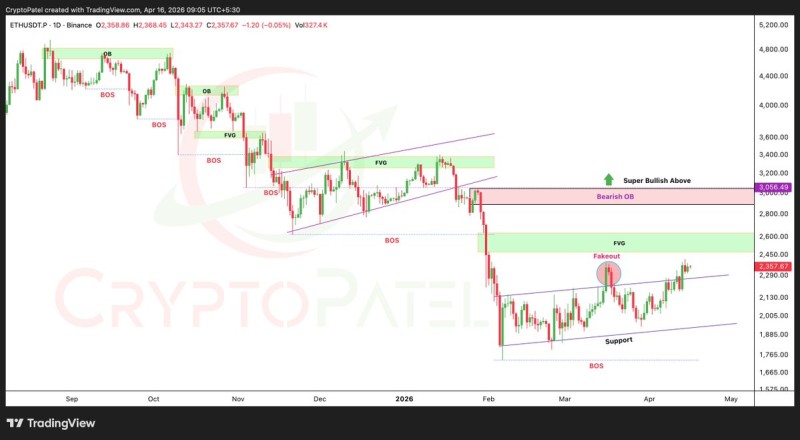
Ethereum has been quietly rebuilding after one of its sharper declines in recent memory. A chart from Crypto Patel shows ETH climbing inside a rising channel, with price now pressing up against an imbalance area that could define the next major move. The setup is straightforward but the stakes are real - buyers need to prove themselves against layers of overhead supply.
The ETH Drop That Set the Bottom at $1,765
ETH fell sharply from around $4,800 down to $1,765, carving out a clean downside structure before demand finally stepped in. That low has since held, and price has gradually transitioned into a recovery phase, forming higher lows along the way. The channel itself is a sign that selling pressure has eased - but eased is not the same as gone.
This kind of base-building after an aggressive selloff is common. The market needs time to digest the damage, and Ethereum appears to be doing exactly that. As detailed in ETH Rebounds 17% as Ethereum Tests Key Channel Resistance, price structure within channels tends to be the defining factor in how trend development unfolds.
The ETH Fakeout Near $2,385 That Reset Expectations
One of the more telling moments in the recent chart was a brief breakout attempt near $2,385. Price pushed above the channel boundary, drew in breakout buyers, and then reversed sharply back inside - a textbook fakeout. That kind of move does not happen in a mature bull trend. It signals that the market is still in a phase where supply shows up quickly at resistance.
The failed breakout near $2,385 trapped buyers and reinforced the idea that ETH has more work to do before any sustained move higher can take hold.
Rather than a sign of weakness, the fakeout at least defined where sellers are positioned. Price knows its ceiling - for now.
Fair Value Gap at $2,474-$2,634 Is the Next ETH Target
Ethereum is currently sitting just below an unfilled fair value gap between $2,474 and $2,634. This is the next logical destination based on the chart structure - an area where price previously moved through without spending much time, leaving an imbalance that tends to attract revisits.
Only a daily close above $3,056 would confirm real strength - everything below that level keeps ETH in a transitional, not trending, state.
Getting through that range would be constructive, but it still leaves a bigger problem above. A broader resistance cluster sits between $2,900 and $3,050, and the chart is clear that only a daily close above $3,056 would signal a genuine trend reversal. Until that happens, recovery remains intact but unconfirmed.
The Key Ethereum Levels That Define Risk and Continuation
The chart lays out a clean framework for tracking this move. Each level plays a specific role, and the sequence matters:
- Price is recovering within a rising channel after the drop from $4,800
- A fakeout near $2,385 reinforced overhead resistance
- The $2,474 - $2,634 fair value gap is the next immediate target
- A confirmed breakout requires a daily close above $3,056
- Support remains near $1,800, with $1,765 as the critical floor
This structure puts Ethereum in a transitional phase - no longer in a downtrend, but not yet in a confirmed uptrend either. A similar dynamic played out in ETH Price Analysis: Ethereum Hits $2,380, Eyes $2,500 Breakout, where price needed to build acceptance above resistance before any continuation could develop. The pattern looks familiar.
The market is approaching a decision point. Whether buyers can push through resistance and hold above it will determine whether this recovery has real follow-through or fades like the last attempt.
 Peter Smith