 Usman Salis

⬤ Ethereum posted a strong rebound on the daily chart, with ETH climbing about 17% from last week's low after hitting a key support zone. The price reached the 50% retracement level around $2,626, which lined up with the 100% extension near $2,628 and touched the lower edge of the descending channel that's been in place since August.
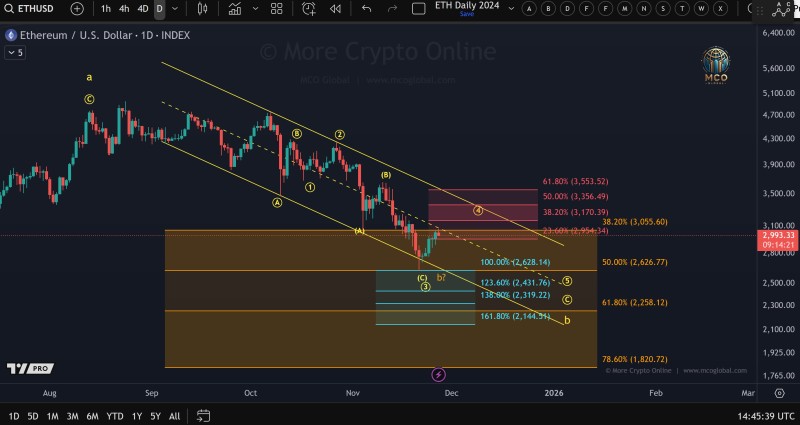
⬤ The chart shows Ethereum continuing to move within this downward channel, with price respecting both the middle line and outer edges throughout the recent selloff. After bouncing hard from the lower zone, ETH is now testing the channel's center line, which has historically acted as a major resistance or support level. This area overlaps with the initial Fibonacci resistance zone between $2,954 and $3,055, where price is currently consolidating.
⬤ The latest bounce still leaves room for additional upside if Ethereum can break decisively above the channel's midpoint. A move toward the $3,170 to $3,356 zone looks possible, backed by higher-timeframe Fibonacci levels and the local Elliott wave structure. These levels form a broader target zone for the next leg up if bullish momentum continues. ⬤ This setup matters across the crypto market since Ethereum's price action often
influences sentiment in the broader altcoin space. A clear break above the channel's center line could shift momentum toward a more positive phase, while rejection here would keep the corrective trend intact. Traders will be watching closely to see if Ethereum can build on its 17% rally or if resistance caps the advance.
 Usman Salis


