Usman Salis
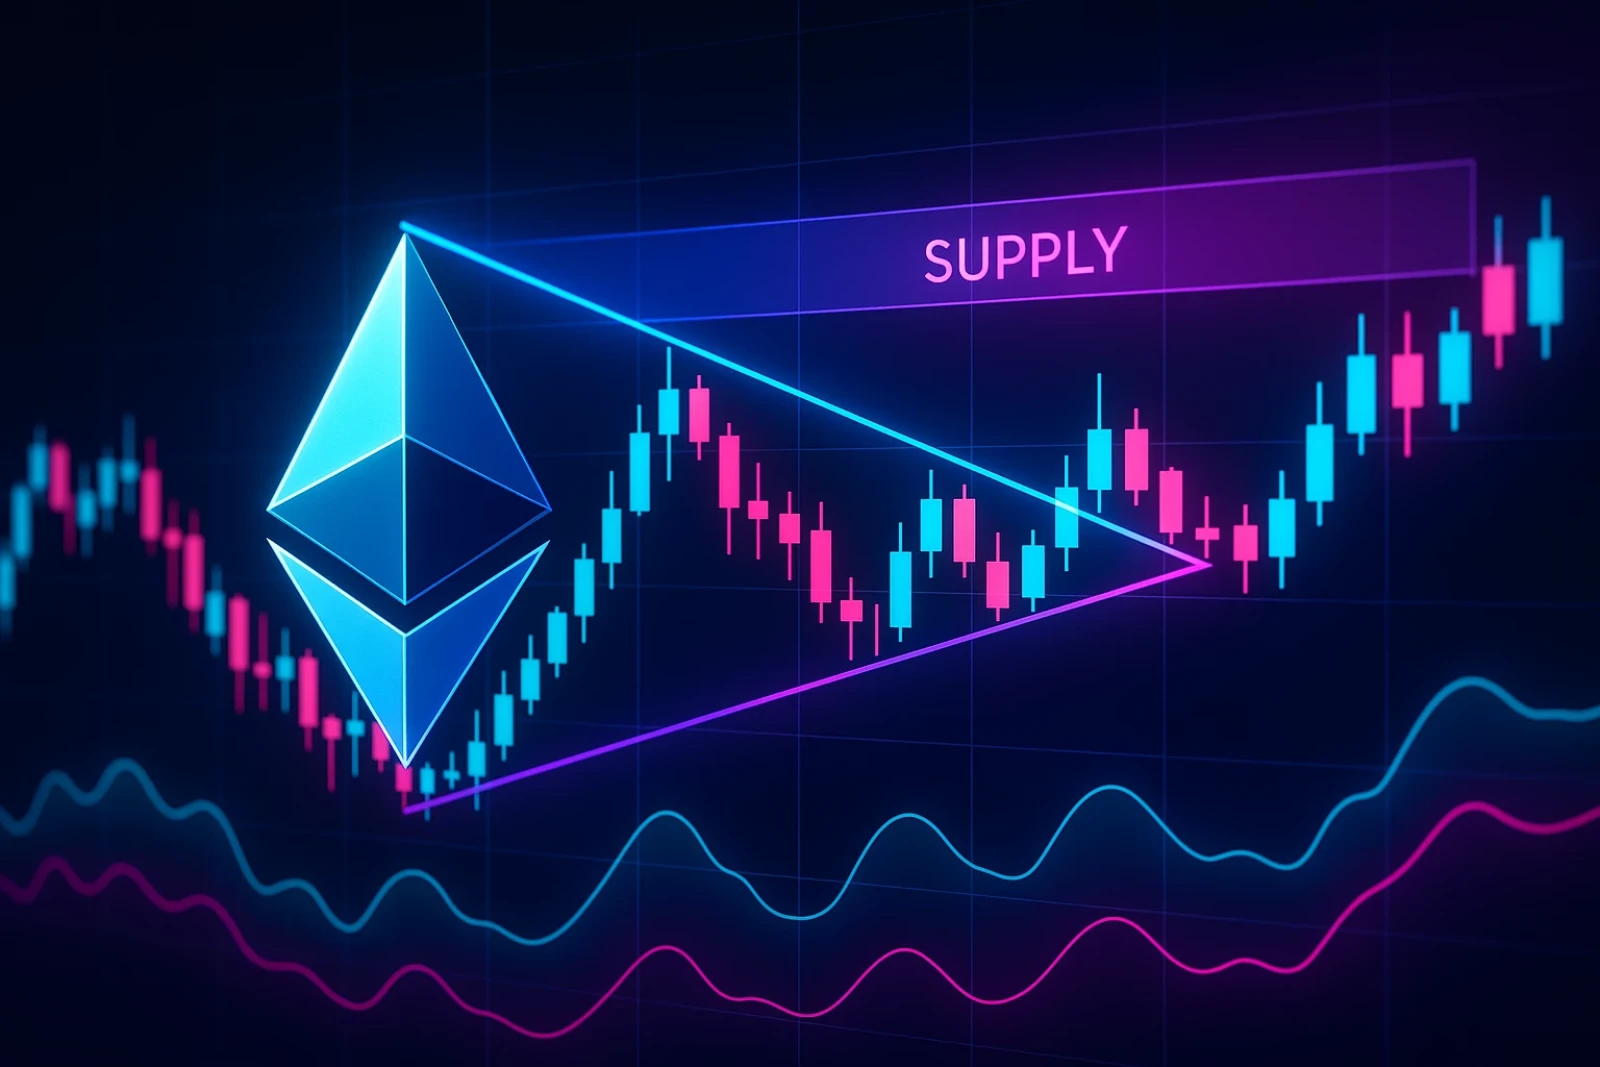
⬤ Ethereum now meets a technical barrier that will decide its next move. Price tests the upper border of a descending wedge and at the same time runs into a thick supply zone - both forces meet at one level. ETH now trades near $3,119 as it tries to push through the ceiling that has pressed it down since mid-August.
⬤ The wedge has pulled prices lower for months - each time ETH touched the downward sloping line it was turned back. The coin now enters a resistance band that stretches from about $3,100 to $3,250, a region where sellers stepped in before. After the bounce from late-November lows near $2,750 ETH has printed multiple green candles - yet it remains beneath the wedge resistance. Volume is solid - traders are active while this technical test unfolds.
Once the wedge resistance and the nearby supply area give way, momentum will flip.
⬤ Patterns of this type often precede large directional moves. The chart shows firm demand zones underneath that caught ETH during earlier declines, but the key issue is whether buyers have enough force to break both the pattern resistance and the supply cluster overhead. When multiple technical factors align at one price level, the reaction tends to carry extra weight and can shift sentiment across the market. A decisive move above this zone could signal a genuine turning point for ETH after months of downward pressure.
 Usman Salis