 Marina Lyubimova

⬤ Ethereum's currently sitting around $2,955 after taking a pretty solid hit on the weekly chart. The price is holding above a crucial long-term support zone, and while it's still moving within that rising channel we've been watching, recent action looks more like consolidation than anything definitive.
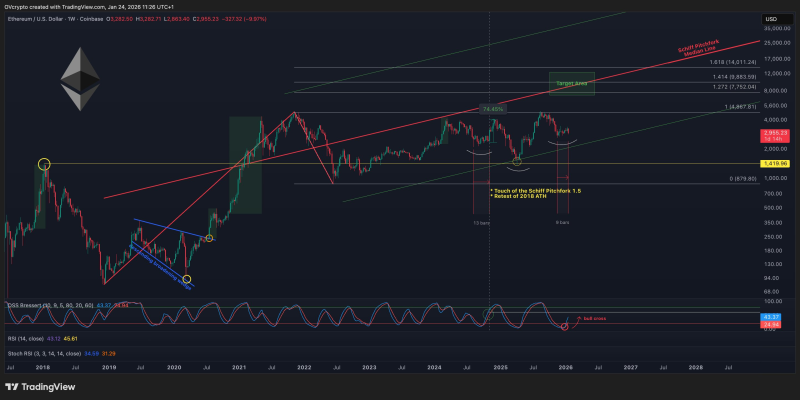
⬤ Looking at the timing patterns, there's something interesting happening here. The left shoulder back in the previous cycle took about 13 weeks to bottom out before ETH climbed roughly 75 percent higher. During that phase, the DSS Bressert indicator flashed a bullish cross around the eight-week mark, setting up that upward move.
⬤ Right now, we're about nine weeks into what could be a right shoulder formation. ETH is trading below the Schiff Pitchfork median line but still respecting that major support area near the old all-time high. It's all about structure and timing alignment at this point—nothing's confirmed yet.
⬤ Why does this matter for the broader market? Ethereum's moves on higher timeframes tend to set the tone across the entire digital asset space. When similar timing patterns show up, it shapes how traders think about volatility and how long consolidation phases might last. The big question now is whether this pattern completes like the earlier cycle or takes a completely different path.
 Marina Lyubimova


