 Marina Lyubimova

⬤ Ethereum is currently trading near $3,000 after bouncing back from a sharp selloff earlier this year. The weekly chart shows a recovery that's now stalled below major resistance levels. Market symmetry analysis reveals several key price zones that need to break for ETH to push higher. After a capitulation phase in early 2025, the price bounced strongly but has since settled into a consolidation pattern beneath these crucial levels.
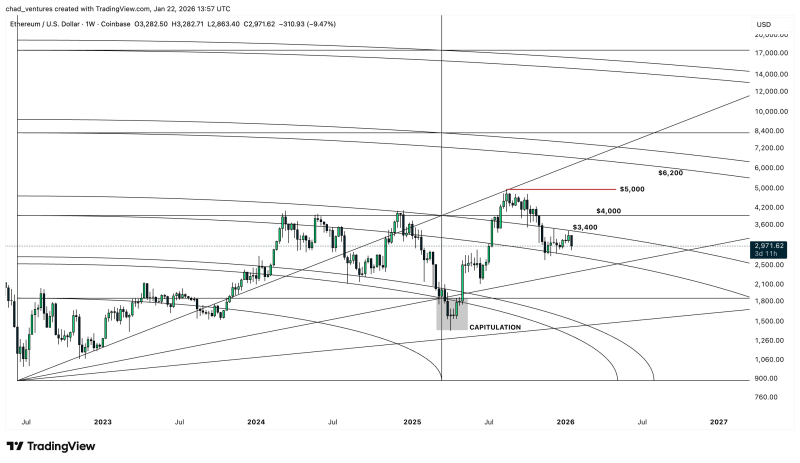
⬤ The first major barrier sits at $3,400, which marks the upper edge of a Gann arc on the technical chart. This zone has repeatedly capped recent rally attempts, preventing any sustained upside momentum. Breaking cleanly above $3,400 would signal that Ethereum's structure is improving and suggest the asset is shifting out of correction mode into a stronger trend.
Market symmetry analysis identifies several important technical levels that must be breached to enable further upside.
⬤ Beyond $3,400, the next big test comes at $4,000—a level that carries both historical weight and psychological significance. Price action has shown repeated reactions around this zone in the past, making it essential for confirming whether the current recovery can turn into a genuine trend reversal. A solid move above $4,000 would dramatically improve the technical picture.
⬤ The final resistance in this sequence is $5,000, representing both a psychological milestone and a major structural checkpoint. Clearing $5,000 would complete the path through all key resistance levels and open the door toward $6,000 and higher, aligning with the next Gann arc projection. These levels will determine whether Ethereum's rebound evolves into a full expansion phase or remains stuck below long-term resistance.
 Marina Lyubimova


