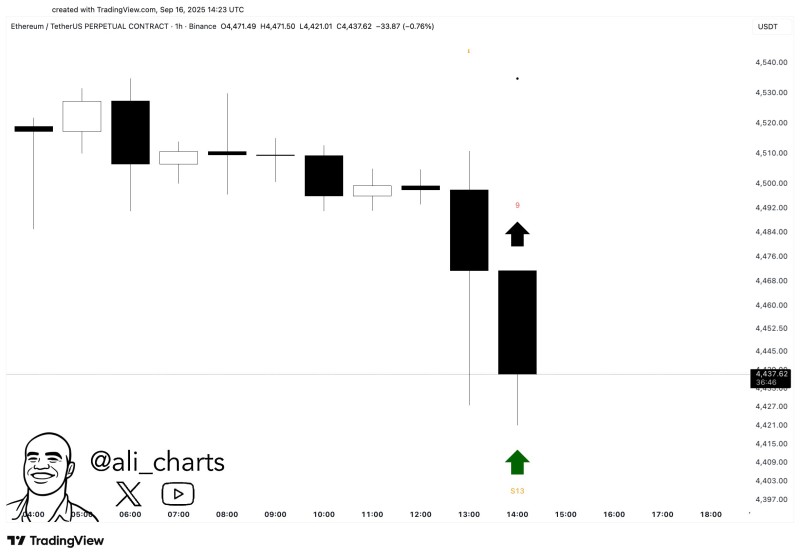
Ethereum (ETH) has caught traders' attention with an unusual technical development that could signal a shift in momentum. After experiencing significant selling pressure that pushed the price down to approximately $4,437, ETH's hourly chart has generated two consecutive TD Sequential buy signals. This rare formation typically indicates oversold conditions and potential for a short-term recovery, though market confirmation remains essential.
Ethereum Flashes a Rare Double Buy Signal
The cryptocurrency market has witnessed Ethereum deliver an intriguing technical setup through back-to-back TD Sequential buy signals appearing on the hourly timeframe. These signals emerged precisely as ETH reached the $4,437 level, suggesting that selling pressure may be reaching exhaustion. Market analyst Ali noted this formation during the recent decline, emphasizing that such patterns often serve as precursors to relief rallies.

The effectiveness of this signal will largely depend on Ethereum's ability to maintain its current support structure and build upon any emerging buying interest.
Chart Analysis: Critical Support Under Scrutiny
The technical picture reveals several important elements supporting the potential bullish narrative. Two consecutive buy alerts marked as 9 and S13 triggered during an intense downtrend, indicating that selling momentum might be waning. The price action showed dramatic bearish pressure with large red candles driving ETH from the $4,470s down to the $4,420s before finding some stability. Buyers appeared to defend the $4,420 area, preventing further deterioration and providing a foundation for potential recovery.
Should momentum begin shifting favorably, initial upside targets would likely focus on the $4,500 to $4,520 range, while more significant resistance awaits near $4,550. The market's response to these levels will determine whether this setup can evolve into a more substantial rebound or merely represents temporary stabilization.
Market Dynamics Supporting Recovery
Several factors are contributing weight to this technical setup beyond the chart patterns alone. Market sentiment has been closely monitoring reversal signals following recent broad-based cryptocurrency pullbacks, making traders particularly attentive to such formations. The double TD Sequential buy pattern suggests that selling exhaustion may have occurred, creating space for buyers to re-enter the market.
Ethereum's fundamental backdrop remains supportive despite short-term price volatility. Continued strong staking flows and robust network activity provide underlying strength to ETH's longer-term outlook, potentially helping any technical recovery gain sustainability.
What's Next for Ethereum
The bullish scenario assumes ETH maintains support above the $4,420 level, which could allow the double buy signal to catalyze a move toward $4,500-$4,550. Successfully breaking above that range might open the path for further advancement to $4,650. Conversely, failure to hold the $4,420 support could lead to additional weakness toward $4,400 or potentially $4,350, where stronger demand zones are expected to provide more substantial buying interest.
The next 24 to 48 hours will likely prove crucial in determining whether this technical setup can translate into meaningful price recovery or if additional consolidation remains necessary before any sustained upward movement can develop.
 Usman Salis

 Usman Salis


