 Saad Ullah

⬤ Ethereum's net inflow of capital turned sharply negative - on chain figures show that liquidity is draining from the main alternative coins. ETH and the top stablecoins now leak funds as money exits both segments. A Glassnode chart that follows the flow of capital into and out of BTC, ETH and stablecoins from late August to November maps the shift exactly.
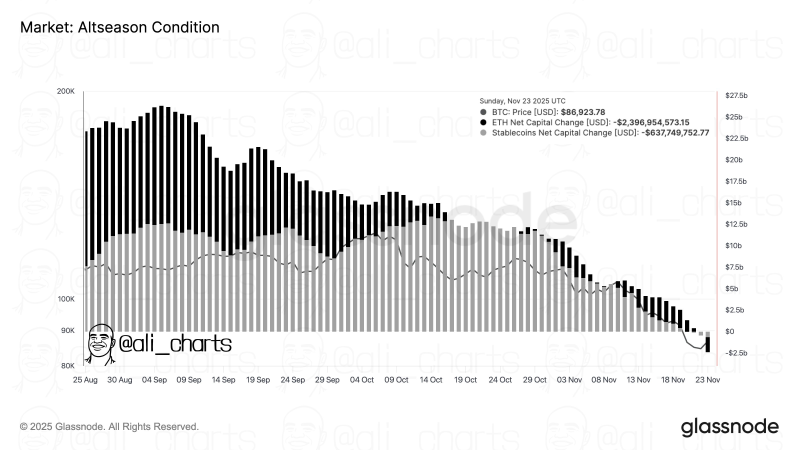
⬤ The data trace ETH's net capital change as it slides week after week, finally falling below zero by late November. Stablecoins mirror the move plus post matching negative values. On 23 November ETH's net capital change reached about - 2.39 billion dollars - stablecoins stood near - 637 million. On that day BTC still quoted 86 923.78 dollars. The shrinking histogram bars show that capital has fled alternative coins and stablecoins since the start of September.
The falling bars confirm that capital keeps leaving alternative coins and stablecoins after early September.
⬤ The histogram drops in a straight line - it peaked near the end of August but also then compressed each month. The chart leaves no doubt that ETH and stablecoin flows lost strength through October besides November, with the weakest readings at the end of the window. BTC alone kept its price high in the set - liquidity drifts away from alternative assets. The steady fall in capital change points to a structural cool down in those markets while the alternative coin season continues.
⬤ The continued drain from ETH and stablecoins will probably steer the wider market, because liquidity patterns set the mood across crypto segments. A negative capital change usually shows that risk appetite has shifted, that traders have repositioned or that funds have rotated toward assets with better relative returns. The present numbers reveal how quickly market structure can flip once liquidity tightens.
 Saad Ullah


