 Artem Voloskovets

⬤ Ethereum broke above its recent swing high on the 1-hour chart, hitting $3,035 before stepping back. The move matches a setup where ETH takes out the high and then pulls back, creating a possible short opportunity before flipping to a long position. Right now, ETH is trading around $3,024 after the breakout, following a wave structure that marks the initial push as wave (i).
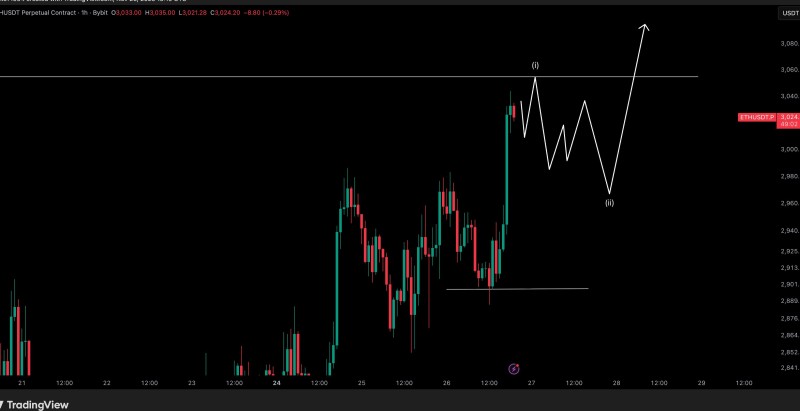
⬤ The chart pattern hints that ETH might be heading into a correction phase. The setup shows a series of lower highs and lower lows, pointing to a wave (ii) pullback. This dip could take Ethereum back below $3,000 before it gathers strength again. That fits the short-then-long approach, where a quick downside move resets things and sets up a cleaner base for the next leg up.
⬤ Even with the expected pullback, the bigger picture shows ETH still has room to climb as long as it stays above the $2,900 support zone. The chart shows a potential bounce from this lower area, illustrating how ETH might recover and get back on track once the correction wraps up. The upward target in the pattern suggests stronger momentum could return after the market digests the short-term dip.
⬤ This price behavior matters because it shows how markets typically move through liquidity grabs and pullbacks. If Ethereum follows this path, the dip could stabilize conditions and build a solid foundation for what comes next. A strong bounce from the lower support would signal improving confidence and clarify whether ETH is gearing up for another rally or staying in a sideways pattern for now.
 Artem Voloskovets


