After weeks of sideways movement and minor pullbacks, Ethereum looks like it's gearing up for something bigger.
Chart Analysis: The Pattern That Keeps Working
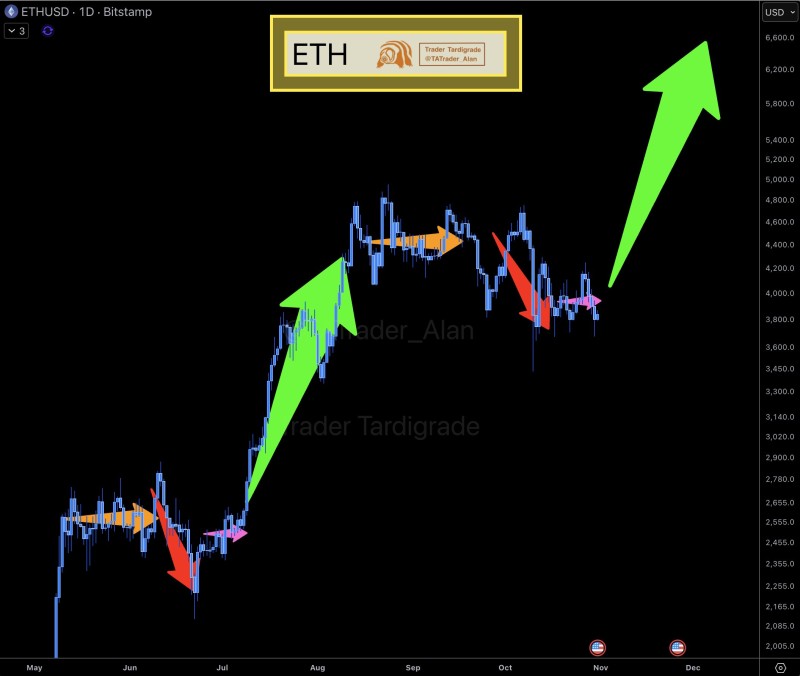
Trader Trader Tardigrade recently shared a chart analysis on X showing that ETH's daily structure mirrors the setup seen before its last major rally earlier this year. The pattern is straightforward: corrections followed by consolidation, then sharp moves higher. If history repeats, Ethereum could be preparing for its next leg up.

The daily ETH/USD chart on Bitstamp reveals a clear rhythm—downward pressure (marked in red), followed by sideways action (orange zones), and then strong upward surges (green arrows). This cycle has repeated multiple times, and ETH seems to be entering another expansion phase right now.
Here's what stands out:
- Support holding at $3,800–$3,900: This zone has caught multiple pullbacks and continues to attract buyers. As long as ETH stays above this level, the bullish case remains intact.
- Resistance zone at $4,400–$4,600: This is the critical breakout area. ETH has tested it several times but hasn't punched through yet—making it the key level to watch.
- Target around $6,000–$6,200: If Ethereum clears resistance, the chart suggests a potential rally toward the $6,000 range, aligning with the projected trajectory shown by the large green arrow.
The repeating pattern—correction, consolidation, expansion—hints that ETH is in the early stages of another upward wave, similar to the run from $2,800 to $4,800 we saw earlier this year.
Market Context
Ethereum's technical setup looks strong even as the broader crypto market takes a breather. Bitcoin is holding steady near recent highs, while growing interest in Ethereum ETFs and upcoming network upgrades like Dencun are helping boost sentiment around ETH. These factors, combined with solid chart technicals, suggest the market could shift from neutral to bullish soon.
For ETH bulls, everything hinges on breaking above $4,600. A clean move through that level could validate the pattern and open the door to $6,000+. On the flip side, if support at $3,800 fails, we might see a temporary dip toward $3,400 before buyers step back in.
Bottom line: as long as Ethereum holds above its support zone, the trend looks constructive. The chart is signaling that another major move could be building—and if the pattern holds, ETH might be gearing up for a significant rally toward new highs.
 Artem Voloskovets

 Artem Voloskovets


