Artem Voloskovets

Dogecoin has completed a breakout above a key resistance zone after multiple failed attempts. The move highlights a clear shift from seller dominance to buyer control on the daily chart. According to Trader Tardigrade, Dogecoin broke out of a descending triangle, with the third attempt at resistance closing fully above the zone - a sequence that frames the move as confirmation rather than an early breakout signal.
A clean technical transition is now visible on the chart. The structure leading into the break shows a descending resistance line pressing down on price while a horizontal support zone holds underneath, forming a classic descending triangle. Multiple candles approached the resistance area but failed to break through on the first two tries, confirming it as a solid barrier.
Dogecoin broke out of a descending triangle, with the third attempt at resistance closing fully above the zone.
Dogecoin Resistance: What the 3-Attempt Sequence Reveals
What stands out is the step-by-step nature of the rejection pattern. The first attempt stayed below the resistance zone entirely. The second reached it and closed right at the line. The third finally closed fully above it. That progression is the core message of the chart - control gradually moving from sellers to buyers over three distinct tests of the same level.
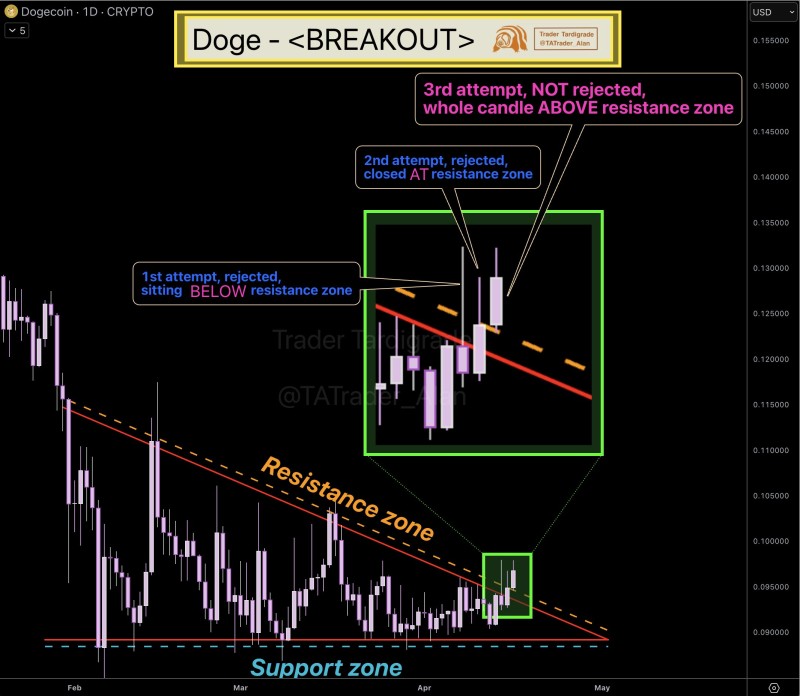
This kind of graduated approach matters in technical analysis because it shows the resistance was genuinely tested and worn down, rather than broken on a single impulsive candle that could easily reverse. Traders watching DOGE price squeezes into a tight range as Dogecoin breakout approaches would have noticed the compression building toward exactly this kind of release.
The first attempt stayed below resistance. The second reached it. The third closed fully above it - that step-by-step shift is the core message of the chart.
How the Third DOGE Candle Changed Everything
The final candle is the confirmation point. Unlike the earlier attempts, it was not rejected and held above the resistance zone on close. In technical analysis terms, that is the change that completes the breakout and invalidates the prior pattern of repeated failure at the trendline.
Worth noting - the chart does not show moving averages or additional indicators. The breakout stands on price action alone: descending resistance, repeated tests, and then a clean close above the zone. That simplicity actually adds weight to the signal. There is no indicator smoothing or lagging data softening the picture. Dogecoin breakout signals bullish shift toward $0.15 - and this chart structure is exactly what that kind of move tends to build from.
Dogecoin After the Break - What the Chart Says Now
With the resistance line breached, the setup no longer reflects seller control inside a compressing triangle. The chart now suggests that the former ceiling has been overcome - and that is why the third attempt stands apart from the first two. The descending triangle pattern, which typically signals continued pressure to the downside, has instead resolved bullishly.
 Artem Voloskovets