 Saad Ullah
Dogecoin (DOGE) is showing signs of a major technical breakout, according to a chart analysis recently shared by a Famous trader on Twitter. The chart highlights an eerily similar setup to one that occurred just before DOGE’s explosive rally in 2024—sparking bullish sentiment among traders who anticipate history could repeat itself.
Historical Pattern Repeats
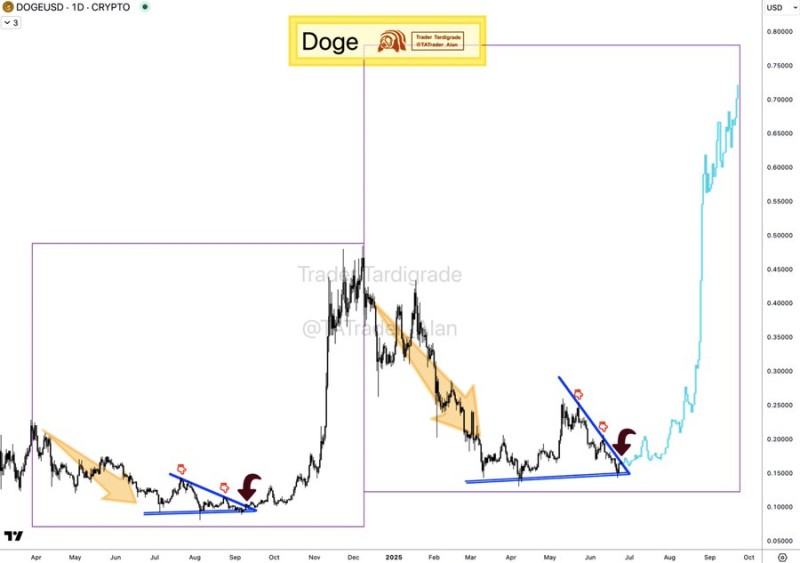
In the chart, two distinct but nearly identical market phases are shown side by side. The first occurred in mid-2024, when DOGE formed a descending wedge followed by a sharp breakout. Now, in 2025, the same structure appears to be taking shape again. Both phases share a downward-sloping trendline, multiple failed breakdowns, and a clear horizontal base — suggesting strong accumulation.
According to the chart, the current DOGE price hovers around $0.20, and if history is any guide, the next breakout could push prices toward the $0.70–$0.75 level. The projection is shown in light blue on the right-hand side of the chart, marking an optimistic move higher if resistance breaks.
Technical Confidence Builds
The chart spans more than a year of price action and captures the psychology of market cycles. Traders note that the descending wedge pattern is often a reversal signal, especially when volume contracts and then surges upon breakout.
The famous trader behind the chart emphasizes that the pattern’s symmetry and timing offer a high-confidence setup. If DOGE breaches current resistance, it could reignite retail interest and potentially mimic the vertical move seen in 2024.
Conclusion
While no breakout is guaranteed, the recurring structure and market psychology behind the pattern give weight to the bullish thesis. As always, traders should watch key levels and manage risk accordingly, but for Dogecoin, all eyes are now on the breakout zone.
 Saad Ullah


