 Eseandre Mordi

⬤ The pattern has become almost predictable at this point. DOGE consolidates in a lower range, pushes up toward resistance between $0.25580 and $0.26986, then pulls back down toward the $0.13-$0.14 demand zone. This same structure has played out several times now, and each cycle looks remarkably similar to the last one.
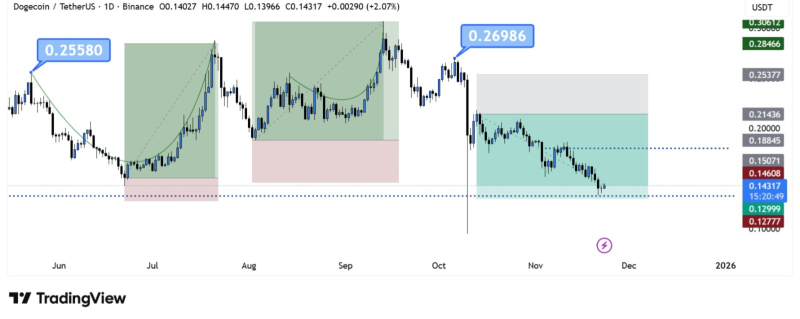
⬤ Right now, Dogecoin is sitting near that key support level again. The chart shows a clear downtrend following the October peak, and momentum has been fading as the price slides back into the demand zone. Historically, this $0.13-$0.14 range has acted as a launching pad for DOGE's moves back up toward the $0.25-$0.27 area. Traders are now wondering if the pattern will hold up one more time or if something different is about to happen.
DOGE once again dipped into support, climbed toward the 0.25–0.27 dollar region, and then reversed lower.
⬤ This setup matters because repetitive price patterns like this one tend to shape how traders position themselves. If DOGE can hold the $0.13-$0.14 zone like it has before, there's a good chance the cycle continues and another push toward $0.25 could be in the cards. But if support breaks down here, it would signal that the pattern might be losing steam and a new trend could emerge.
⬤ The next few days will be telling. Either Dogecoin bounces from this familiar level and keeps the cycle alive, or it breaks through support and forces traders to rethink what comes next. For now, all eyes are on whether history repeats itself once again.
 Eseandre Mordi


