 Usman Salis
⬤ Dogecoin took a sharp dive on the weekly timeframe, dropping over 13% to around $0.1553. That puts DOGE right on top of a critical support zone that traders have been watching closely. The weakness in recent weekly candles suggests buying momentum has dried up, and the focus now shifts to whether this support level will hold or crack.
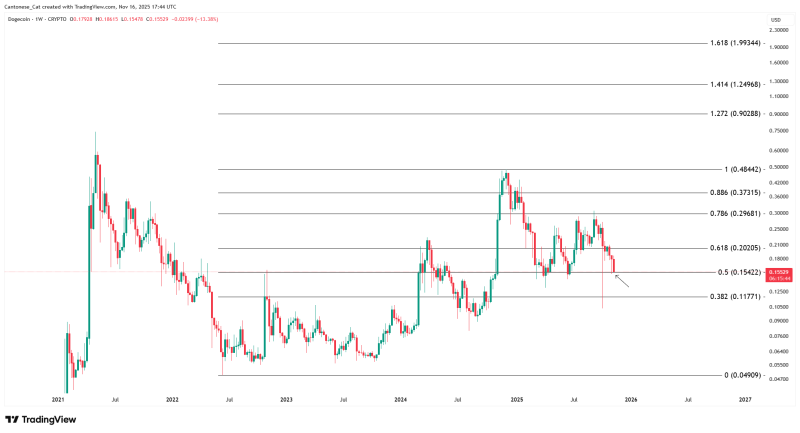
⬤ Looking at the broader picture, DOGE is sitting at the 0.5 Fibonacci retracement level near $0.1542. Earlier this year, the price tried to bounce from higher zones—including the 0.618 level at $0.202 and the 0.786 region around $0.297—but each rally stalled out below key resistance. The latest weekly candle dipped below the support area, signaling reduced buying strength and a continuation of the downtrend.
⬤ The longer-term chart shows DOGE working through a deep correction from its past highs. With the price pulling away from the $0.30 range, the next potential landing spot is the 0.382 Fibonacci area around $0.118. A string of red weekly candles points to ongoing selling pressure, with lower highs and lower lows forming a clear downward pattern over the past few months.
⬤ These Fibonacci levels matter because they often shape market sentiment during extended corrections. How DOGE reacts here could influence expectations around whether the downtrend continues, how volatile things get, and how other digital assets respond. The recent drop underscores lingering uncertainty in the meme coin space and highlights why chart-based signals are so important right now.
 Usman Salis


