 Saad Ullah
⬤ Cardano is holding onto a crucial daily support zone that's keeping a long trade setup alive even as the broader market shows weakness. The setup stays valid only if daily candles keep closing above a specific green line on the chart. Right now, ADA is trading around $0.426, with recent price action hovering right near the support level that determines whether this trade continues or gets wiped out.
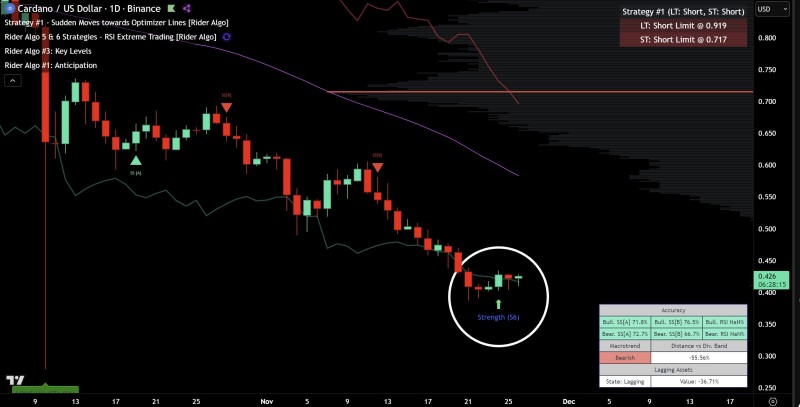
⬤ The chart makes it crystal clear where the line is drawn—that green support level is the exact boundary that defines the risk. If the price closes below it, the long setup is instantly dead. No guessing, no maybes. The indicators also show a "strength" signal in a circled zone, marking a spot where buyers tried to stabilize things. The bigger picture still looks bearish according to the macrotrend label, but the long setup stays in play because that support line hasn't broken yet.
⬤ If this support area keeps holding, the upside potential becomes pretty significant because the risk-reward ratio is heavily skewed in favor of the reward. The chart shows ADA consolidating tightly just above this level, which creates a situation where the downside is capped but the upside could be substantial if the move plays out. The structured approach makes these setups easier to spot and manage with clear entry and exit points.
⬤ This is a critical moment because ADA is trading exactly at a level where the entire setup lives or dies based on where each daily candle closes. These clean, well-defined structures can shape short-term sentiment, especially when the potential loss is tiny compared to the possible gain. Whether Cardano stays above this support line will decide if this setup turns into a bigger upward move or collapses and resets the pattern entirely.
 Saad Ullah


