 Peter Smith
Cardano (ADA) is capturing renewed attention from the trading community as its monthly chart structure begins to echo patterns from the early 2020 cycle. With ADA consolidating around $0.87, technical indicators suggest the token might be positioning for a significant bullish breakout that could mark the beginning of its next major rally.
Cardano's Monthly Chart Points to a Reversal
The current setup on ADA's monthly timeframe is drawing comparisons to pre-2021 bull run conditions. Analyst Sssebi highlighted that ADA's current positioning could lead to a sharp breakout - what some call a "God Candle" - if momentum continues building.
The monthly chart shows ADA has established a solid foundation above key support levels while approaching critical resistance zones that could determine its next major move.
Chart Analysis: ADA's Long-Term Outlook
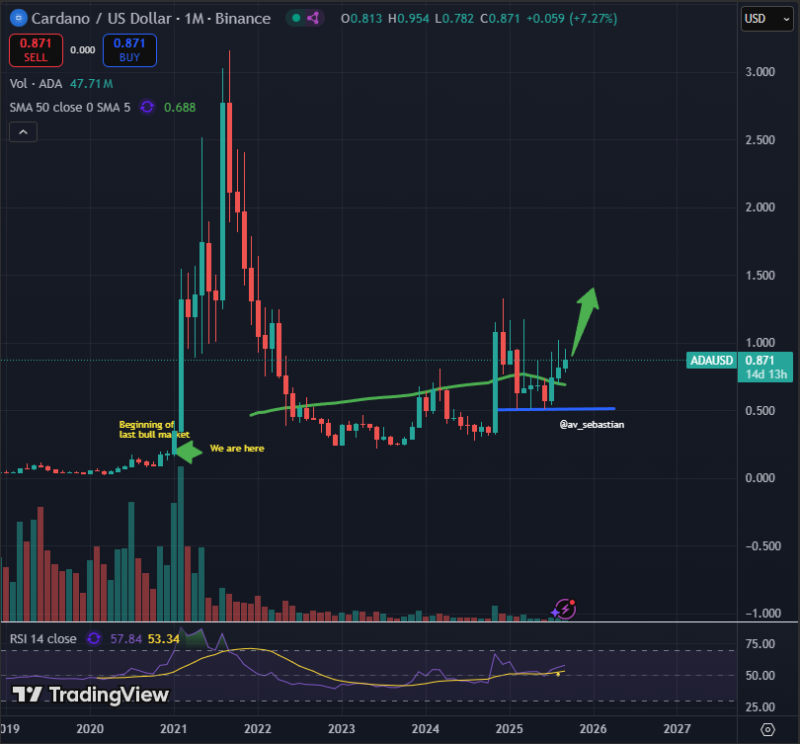
The ADA/USD monthly chart reveals several compelling technical factors. Strong support has formed in the $0.50–$0.55 range, which has served as a reliable base since 2023, marked by the blue support line on the chart. Key resistance levels await at $1.00 and $1.50, where a break above these zones would confirm trend reversal and likely attract broader market participation.
After reaching above $3.00 in 2021, ADA underwent a significant correction. However, the token now displays higher lows and has successfully reclaimed its 50-month moving average around $0.69, representing a bullish technical signal. The RSI indicator sits at 57.8, climbing from oversold territory and suggesting strengthening upward momentum. The chart's annotation "We are here" indicates ADA may be at the same developmental stage that preceded the explosive 2020–2021 rally.
Why ADA Could Be Gearing Up
Several factors are converging to support a potential breakout scenario. Market rotation is becoming evident as Bitcoin stabilizes near cycle highs, prompting investor attention to shift toward altcoins like Cardano. The project's fundamentals remain solid, with its growing ecosystem of DeFi applications, staking mechanisms, and NFT projects continuing to drive long-term adoption. Most notably, the current chart structure closely mirrors the consolidation pattern that preceded ADA's previous bull run.
ADA Price Scenarios
- Bullish outlook: Maintaining levels above $0.69 and breaking through the $1.00 barrier would likely accelerate momentum toward $1.50. A confirmed monthly breakout could produce the steep price movements characteristic of early bull market phases.
- Bearish scenario: Should ADA fail to defend the $0.68–$0.70 zone, the bullish setup would weaken considerably, potentially sending price back to test its long-term support floor near $0.50.
 Peter Smith


