 Usman Salis

⬤ Bitcoin's long-term price structure is flashing a pretty clear signal — the next four-year cycle low might land in October. Looking at the monthly chart, BTC is currently trading near the upper end of its historical range, while key yearly pivot supports are sitting well below. Here's the thing: each successive four-year Bitcoin cycle has been shortening by roughly one month, and that pattern is pushing the expected low right into October territory.
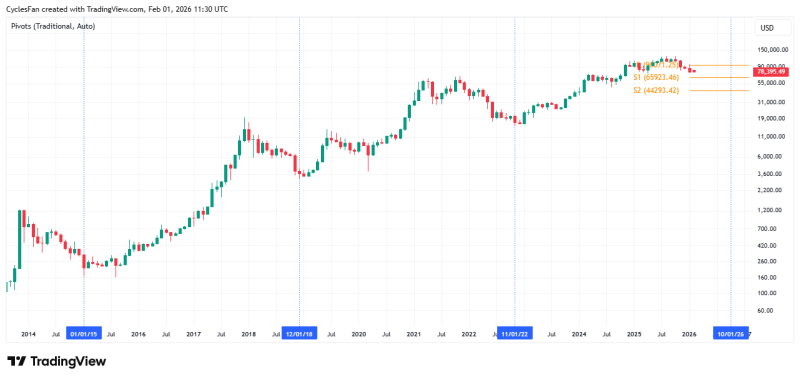
⬤ The first major level to watch is the yearly support around $65,923. This is where BTC is expected to get tested first — likely around March — and historically, similar pullbacks to this kind of support have always happened before any deeper drop kicked in. So if price starts sliding toward that zone, it doesn't necessarily mean panic. It's actually pretty normal for the cycle.
Each successive four-year Bitcoin cycle has shortened by roughly one month — shifting expectations for the upcoming cycle low into October.
⬤ Below that, the second yearly support around $44,293 is where the actual four-year cycle low is projected to land. This deeper zone lines up with where prior long-term cycle bottoms have formed. The model expects a multi-month bounce after the first support gets tested, followed by a second leg down into October before the bottom is in.
⬤ Why does this matter? Because it gives traders a concrete framework — both in timing and price levels — to navigate what's ahead. As long as Bitcoin's historical cycle rhythm holds, these two supports will be the levels that define the next major bottom. All eyes are on how price reacts when it gets there.
 Usman Salis


