Usman Salis

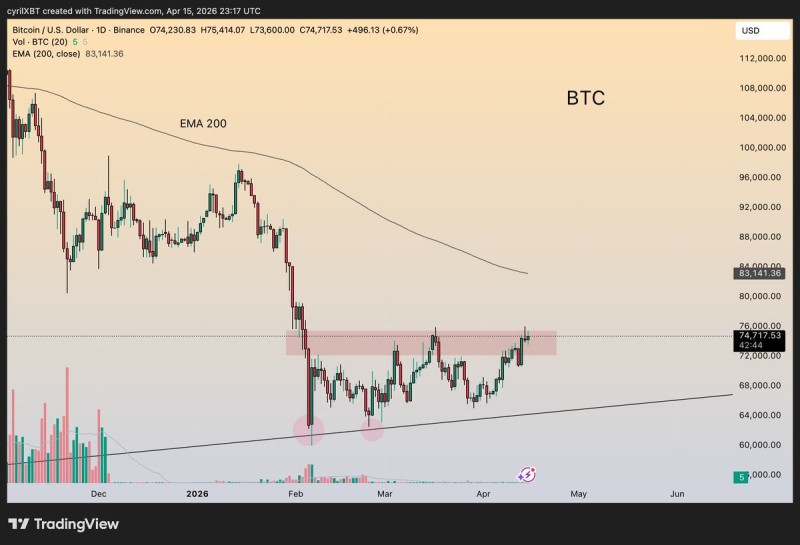
Bitcoin is pushing into the upper boundary of its current range again, and the reaction around $76,000 is increasingly defining short-term structure. According to CyrilXBT, a clean daily close above that level is the one thing standing between range-bound consolidation and a proper structural shift - and so far, the market has failed to deliver it.
The broader picture is one of compression. Price keeps revisiting $76K, getting turned away, then finding its footing somewhere inside the $72K-$76K band. It is not a breakdown, but it is not a breakout either - it is a market waiting to decide.
A clean daily close above $76K is required to shift structure. Until then, the market remains range-bound.
The $76K Level That Keeps Rejecting BTC
Multiple attempts at $76,000 have come and gone with the same result: a rejection. Each failed breakout adds weight to the level as a genuine ceiling, not just a coincidental pause. The structure is readable - repeated tests with no follow-through typically signal that the supply sitting at that price is meaningful.
This pattern is not new. BTC Rejected at $76K as Bearish Structure Points to Sub-$50K documented how this same zone has acted as a persistent barrier in recent price action, with consequences extending well beyond the immediate range.
What makes the current setup different - or at least more pressing - is the tightening beneath it.
Price is being squeezed into a narrower range with each passing day - horizontal resistance above and rising support below leave less room for indecision.
The Ascending BTC Trendline Holding Since February
Beneath the current price, an ascending trendline running from the February lows is doing the heavy lifting on the support side. It has been tested multiple times and has held, creating a sequence of higher lows that keeps the short-term structure from turning outright bearish.
The combination of horizontal resistance at $76K and rising support below forms a compression wedge - a shape that typically resolves with a directional move once price runs out of room. That moment is getting closer.
Earlier analysis in Bitcoin Falls Below $68K - Reclaiming $70K Is Now Critical showed what happens when trendline support gives way - the $72K-$76K zone became a source of resistance on the way back up, and the recovery was slow and choppy.
A breakdown below the February trendline would not just be a technical signal - it would invalidate the entire sequence of higher lows that has kept the recovery narrative intact.
200 EMA at $83K Keeps BTC in Neutral Territory
Above the current price, the 200-day exponential moving average sits around $83,000, unreclaimed and firmly overhead. As long as BTC trades below it, the broader structure stays in a neutral-to-recovery phase rather than a confirmed uptrend. Resistance is layered - first $76K, then a gap before the 200 EMA adds another ceiling above.
This context matters. The range-bound behavior between $72K and $76K looks less like healthy consolidation and more like a market still figuring out whether the recovery has legs. The 200 EMA is the line that would change that read - but getting there requires clearing $76K first.
Related history on how repeated resistance failures can define short-term trajectory is covered in Bitcoin Faces Fresh Rejection at $70K - $66K Support Under Fire, where a similar failure at resistance led to a broader structural reassessment.
BTC below the 200 EMA means the bigger picture has not shifted yet - a confirmed uptrend needs that level back as support, not resistance.
BTC Range Setup: 4 Key Factors Before the Next Move
The current structure comes down to four things:
- Price is capped at $76K after multiple rejections
- Support is rising via the ascending trendline from February lows
- BTC remains inside the $72K-$76K range
- The 200 EMA at $83K sits above price, limiting upside structure
Neither side is fully in control. The trendline is holding, but each new test of $76K that fails chips away at bullish conviction. A confirmed daily close above $76K changes the picture - it shifts structure, opens the gap toward $83K, and gives the recovery something to build on. A break below the ascending trendline changes the narrative in the opposite direction.
 Usman Salis