Marina Lyubimova

As Lennaert Snyder noted, the long setup above $72,000 remains valid - but the current concern is that continued grinding lower from here would make a test of the range lows a more logical reaction. The chart reflects exactly that tension: BTC is sitting just below the $72,033 liquidity level, while lower liquidity and an unfilled CME gap remain in play beneath the market.
The BTC Barrier That Still Has Not Given Way
The chart shows Bitcoin repeatedly leaning into the $72,000 zone without delivering the kind of clean expansion that would confirm a breakout. That matters because this is not simply a resistance mark on the screen - it is labeled as liquidity, which means it is a level the market is likely to attack only if momentum is strong enough to sustain the move.
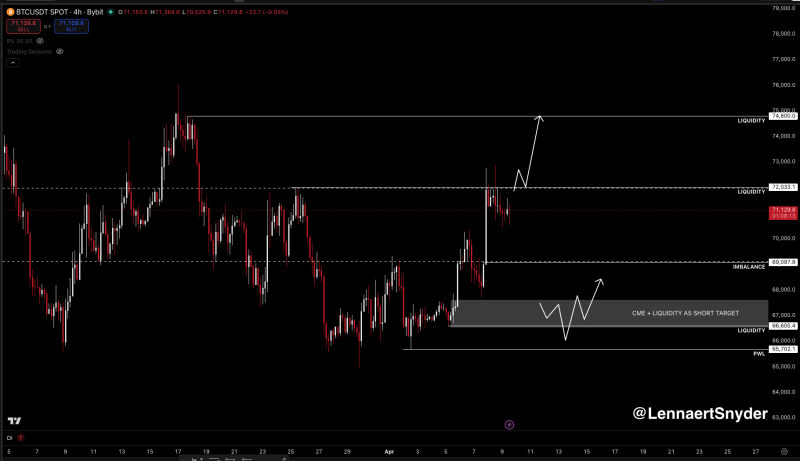
Price is hovering around $71,100-$71,200, still beneath that trigger. The longer BTC stalls here without acceleration, the less convincing the bullish case becomes in the short term.
BTC Holds $68K, Tests $71K Resistance captured the earlier stage of this same resistance interaction, showing how Bitcoin has been leaning into the $71K-$72K zone repeatedly without resolving the structure in either direction.
Why the $67K-$68K Area Matters More for BTC Now
The more cautious reading comes from what sits below current price. The chart marks an imbalance around $69,097, lower liquidity near $66,605, and a CME-related target zone centered around the mid-$67,000s. The main concern is that the roughly $68,000 low could become internal range liquidity rather than a durable launchpad for upside.
That lines up with the unfilled CME gap around $67,400. In range conditions, unfinished business below price often becomes a magnet if upside momentum fails to build quickly enough.
BTC Tests $71K Resistance: Will It Break to $74.6K or Drop to $67.5K? framed exactly this binary outcome before the current stall developed, showing how the $67.5K and $74.6K targets have been the two endpoints defining Bitcoin's range structure.
BTC Caught Between Breakout and Rotation
What makes the setup compelling is that both paths remain visible on the chart. One projected path shows BTC reclaiming the $72,033 liquidity area and pushing toward the next upside objective around $74,800. The other shows a drop back into the gray support zone, where CME inefficiency and lower liquidity cluster together before a potential rebound attempt.
Bitcoin Stuck in $60K-$71K Range: Will BTC Break Out Soon? places the current stall within the broader range-bound behavior that has defined Bitcoin for an extended period - reinforcing that patience rather than anticipation is the appropriate posture until price either powers through $72,000 or rotates into the lower range targets.
 Marina Lyubimova