 Usman Salis
⬤ Bitcoin's latest weekly candle closed around $96,203 following an 8.06% decline. The broader pullback from recent highs near $107,400 totals 25.88%—marking it as the smallest correction of this cycle. Despite being less severe than previous drawdowns, the market reaction has been noticeably louder this time around.
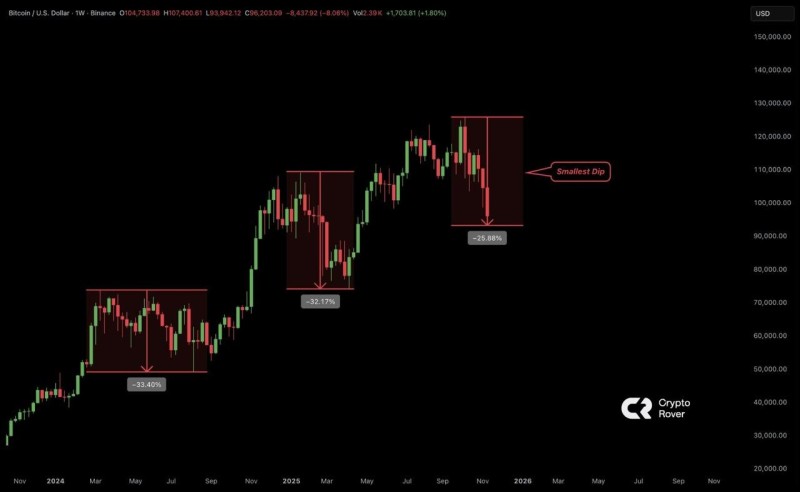
⬤ The chart compares three major corrections across the current cycle. The first drop was roughly 33.40%, the second around 32.17%, and the latest just 25.88%. Each pullback is marked as a boxed zone on the weekly chart, showing a clear pattern of recurring retracements after strong rallies. While BTC dipped into the mid-$90,000s, it hasn't broken the broader uptrend that's been building over recent months.
⬤ What stands out is the contrast between price action and sentiment. The smallest dip has triggered one of the strongest emotional responses, revealing just how sensitive traders have become during this volatile phase. Bitcoin continues forming higher lows across the cycle, suggesting the long-term trend remains intact even as short-term psychology swings wildly.
⬤ This pattern matters because it shows how perception and reality can diverge. When a relatively shallow correction sparks outsized fear, it highlights both the maturity of the cycle and how quickly sentiment can flip in volatile conditions. For now, Bitcoin's structure suggests continuation—even if the crowd isn't convinced yet.
 Usman Salis


