Peter Smith

BNB is holding steady inside a clearly defined support band. The $300 to $500 range has historically lined up with accumulation phases on the chart, and the current structure looks more like a pause than a breakdown. According to Crypto Patel, this region is shaping up as a key accumulation area - one worth watching closely heading into the next potential trend phase.
The $300-$500 Range That Defines BNB's Current Structure
The chart shows BNB trading within a horizontal support band marked roughly between $300 and $500. This area carries a dual label on the chart - both a "Support Zone" and a "Best Accumulation Zone" - which signals just how significant this level is in the current setup. Price pulled back into this zone after a prior move higher, with the broader structure shifting into consolidation territory. The range also overlaps with multiple Fibonacci retracement levels, adding further technical weight to its relevance.
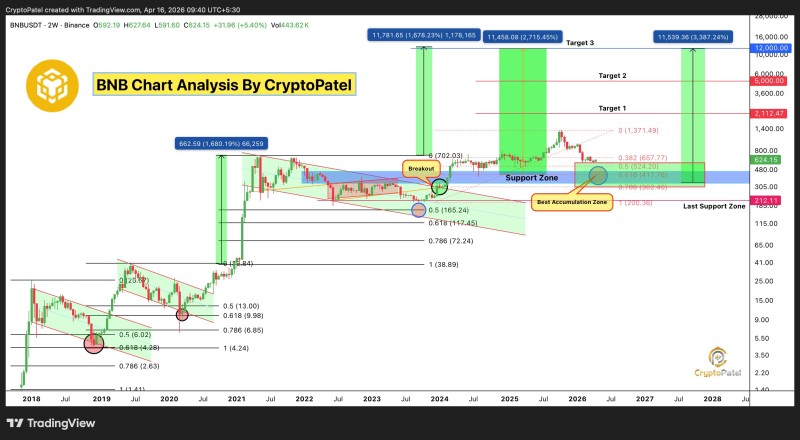
This region is being framed as a key accumulation area - one where smart money tends to position before the next major expansion phase begins.
BNB Accumulation History: A Familiar Pattern Before Expansion
The chart highlights earlier phases where BNB consolidated for extended periods before breaking into strong upward moves. These accumulation windows were followed by significant expansions - each one visible on the chart as a distinct leg higher. The tweet references past cycles of strong returns, and that narrative fits neatly with the repeated structure of accumulation followed by breakout that BNB has shown across multiple market cycles.
Past cycles show accumulation zones as the starting point for BNB's biggest moves - the current structure mirrors those same setups almost perfectly.
Recent market coverage reflects a similar pattern, where BNB tends to consolidate near support before attempting directional moves. BNB tests critical $600 support with eyes on $760 recovery target described price stabilizing near a demand zone before a potential rebound - behavior that aligns with what the chart is showing right now in the $300-$500 band.
BNB Long-Term Targets: $2,000, $5,000, and $10,000 in Focus
The chart outlines projected targets at three distinct levels:
- $2,000 - first major expansion target above current consolidation
- $5,000 - mid-range projection based on prior breakout cycles
- $10,000 - long-term target reflecting full expansion from accumulation
These levels are long-term projections rooted in previous expansion cycles rather than near-term price action. That kind of technical thesis is well documented - BNB price: bulls target $2,400 rally outlined a comparable scenario, where a breakout from accumulation led analysts to set significantly higher projected levels as the next logical destination.
Breakouts from well-formed accumulation zones have historically sent BNB toward levels that looked unrealistic during the consolidation period itself.
That said, not every consolidation phase resolves to the upside. When support fails to hold, the correction can be sharp and extended - as BNB price analysis: Binance Coin drops below 2-week channel as $600 support gets tested showed, a breakdown can shift the entire technical picture quickly. The outcome at $300-$500 will be just as binary.
BNB Market Outlook: Stability, Not Direction - Yet
The current price action reflects balance rather than momentum. BNB is holding within a defined range, with neither a confirmed breakout nor a clear breakdown visible on the chart. The structure emphasizes accumulation, not expansion - at least for now. The next decisive move will depend entirely on whether price can transition from this range into a new trending phase. For now, BNB remains positioned within a historically significant zone. The chart points to stability, not direction - but in markets, prolonged stability inside a strong accumulation zone rarely stays quiet forever.
 Peter Smith