Usman Salis

⬤ BNB continued pulling back on the daily chart, closing near $931.75 as downside momentum held. After breaking cleanly below $1,080, the price moved into the mid-$900s as part of the ongoing correction. The earlier drop from $1,080 down to around $880 played out as expected, and the chart now shows room for a deeper move into the next major support zone. Despite short-term weakness, the long-term outlook remains intact as volatility picks up.
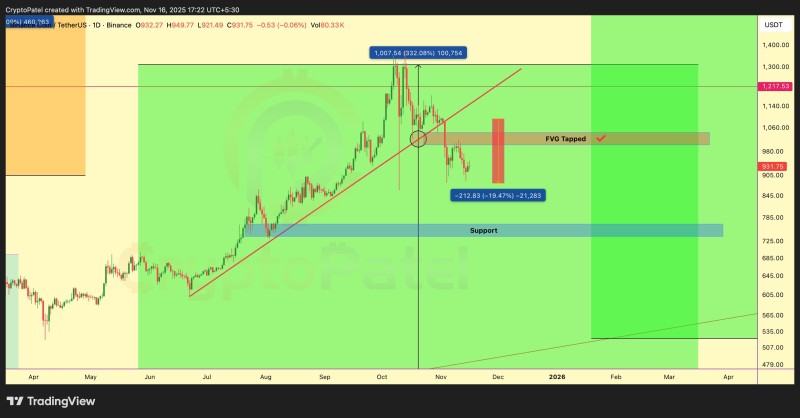
⬤ The chart highlights several key technical levels shaping BNB's current move. The asset previously rallied to a peak around $1,007.54—a 332% gain—before reversing. A rising trendline that supported the rally from early summer broke during the recent decline, shifting the structure into correction mode. A fair value gap on the chart has been filled, signaling a completed imbalance. The measured drop of $212.83 (down 19.47%) aligns with the multi-week pullback now underway. The $770–$730 zone stands out as the next major support area and potential accumulation base.
⬤ BNB remains within a broad upward structure that's been building for months. Price has pulled back from above $1,217 while forming lower highs and lower lows since the trendline break. The chart layout emphasizes the sharp rally earlier in the cycle, the trendline failure, and the current descent toward the next structural level. These signals frame the pullback as a correction within a larger trend—not a full reversal.
⬤ BNB's approach to these defined support levels matters because they often shape sentiment and set the stage for the next phase. When price hits large accumulation zones during volatile periods, it can mark transition points in longer cycles. With a confirmed breakdown structure, a clear support target, and expanding volatility, BNB is now at a pivotal technical moment.
 Usman Salis