 Usman Salis

⬤ Bitcoin's monthly chart on BTC is showing momentum signs that we might be looking at a significant long-term low. The Relative Strength Index is pointing to this month potentially being the bottom for the next couple of years. Looking at the historical data, similar RSI behavior has come right before major bull market phases.
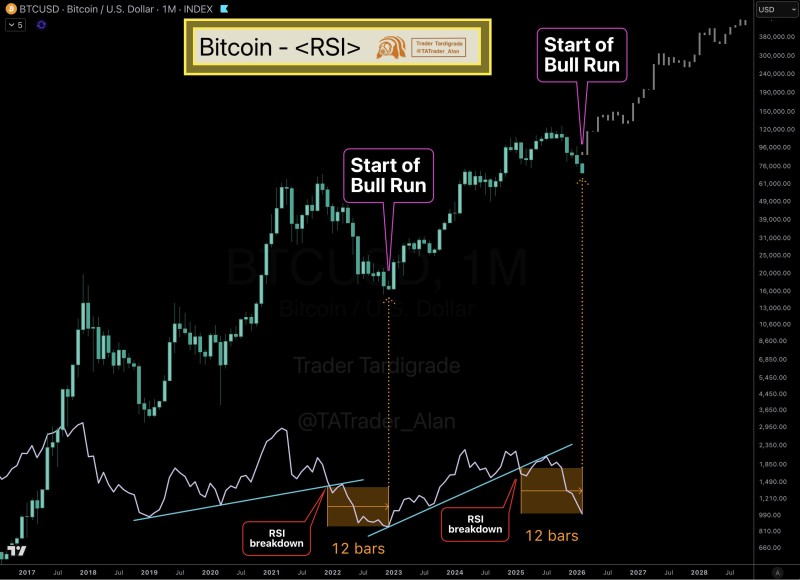
⬤ If you check out previous cycles, there's a clear pattern - RSI breaks down, then we get about 12 months of consolidation before price takes off into strong uptrends that kick off the next bull run. Right now, the RSI formation looks nearly identical to those earlier setups.
⬤ Bitcoin's been stabilizing after its broader moves, and the RSI is trending toward what looks like a bottoming zone. Past market cycles showed the same timing - RSI hits these lows, then price expands significantly afterward. We're seeing those same conditions play out now as the market transitions from consolidation into what could be expansion mode.
⬤ The monthly timeframe matters here because momentum shifts on higher timeframes tend to drive long-term market direction. If this RSI pattern completes like the previous cycles did, we could be watching the early stages of the next major bull run taking shape across the crypto market.
 Usman Salis


