 Saad Ullah

⬤ Bitcoin's weekly Moving Average Convergence Divergence indicator is showing signs of a potential momentum shift. The chart reveals the MACD forming a rounded bottom below the zero line—a structure that's appeared before upside momentum strengthened in the past. While BTC remains below its prior peak, it's stabilizing after a prolonged decline.
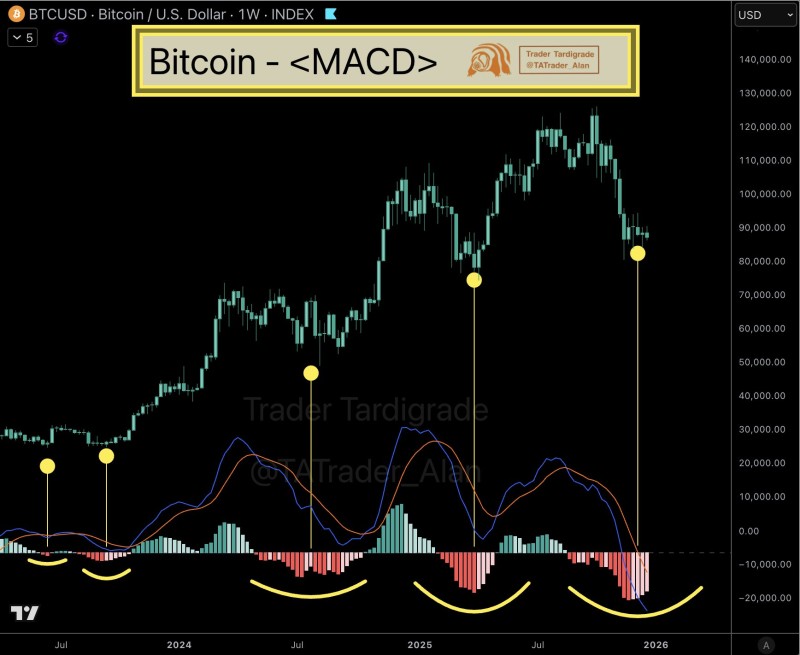
⬤ The weekly MACD lines are curling upward from deeply negative territory, and the histogram bars have started contracting, pointing to weakening downward pressure. Multiple markers on the chart highlight past instances where this same MACD behavior preceded stronger price recovery phases. The pattern repeats consistently, with each MACD trough aligning with a significant price low.
⬤ Bitcoin continues trading within a broad long-term cycle, and the weekly MACD helps assess whether momentum is shifting over extended timeframes. While the indicator doesn't predict price direction with certainty, the current formation suggests the selling pressure that dominated earlier may be easing—similar to prior periods shown on the chart.
⬤ This matters because the weekly MACD reacts more slowly than short-term indicators, meaning trend changes at this level can carry broader implications. If the signal continues strengthening, it could mark the early stages of renewed market momentum and influence sentiment across the wider crypto market.
 Saad Ullah


