Saad Ullah

⬤ Bitcoin is hovering at a pivotal technical crossroads as price tightens beneath its EMA ribbon structure. BTC has already faced two rejections from the EMA ribbons and is now testing them for a third time, putting the market at a clear decision point. The chart shows Bitcoin trading just above $87,700 horizontal support while multiple exponential moving averages continue blocking upward momentum.
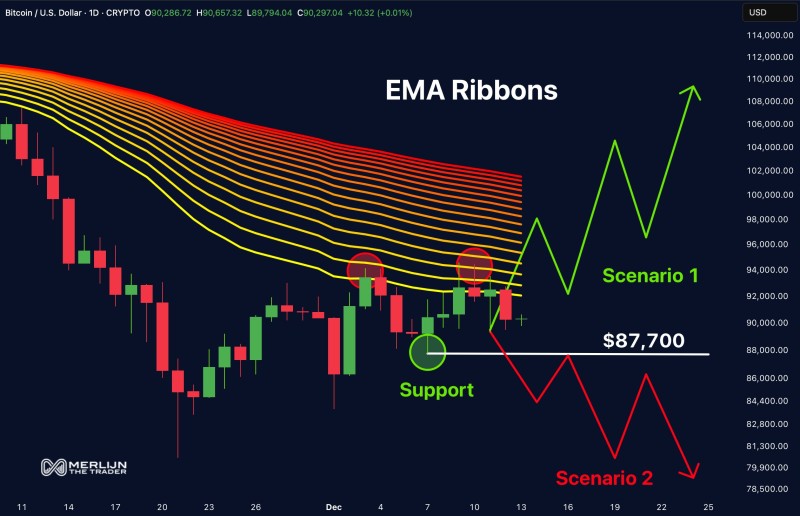
⬤ The EMA ribbons form a downward-sloping resistance band that's repeatedly stopped bullish attempts. Each previous touch of this zone triggered a pullback, proving its technical significance. Right now, price is sitting directly under the EMA cluster in a tight squeeze as traders wait for a breakout signal. The $87,700 level serves as immediate support—the line between holding steady and dropping further.
⬤ The chart maps out two potential scenarios. If Bitcoin holds above $87,700, price could bounce higher and break through the EMA ribbons, opening the door to further gains. But if it loses this support, BTC could drop into the low $80,000s. The setup shows how compressed price has become between overhead resistance and floor support.
⬤ EMA ribbons typically define trend direction during consolidation phases like this. When price finally breaks free from these tight ranges, the move tends to be sharp and decisive. With Bitcoin squeezed between clear resistance and support levels, the next sustained break will likely shape near-term momentum across the broader crypto market as volatility picks up.
 Saad Ullah