 Peter Smith

⬤ Bitcoin is sitting at a make-or-break point right now. After tumbling from recent highs, BTC has found some footing around $77,000, bouncing off a rising trendline that's been holding up through the turbulence. The big question everyone's asking: can it punch through the resistance zone overhead and actually hold it?
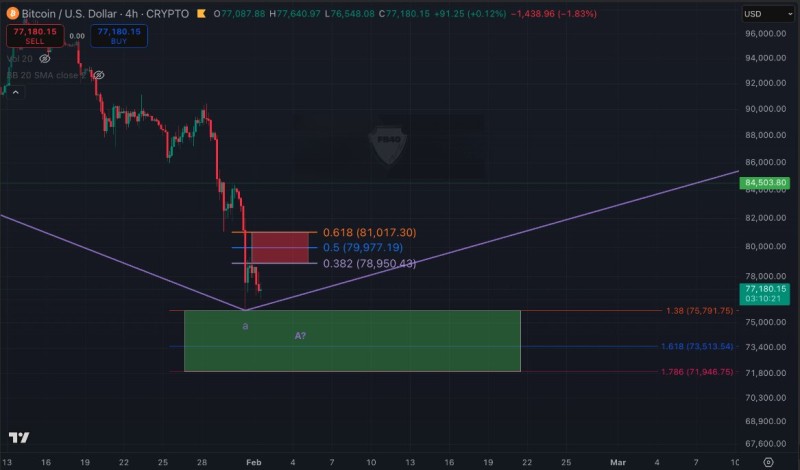
⬤ That resistance isn't just a random line on the chart—it's a wall of Fibonacci levels stacked between roughly $78,950 and $81,017. Price keeps trying to break through and getting slapped back down, which tells you sellers are still showing up at those levels. Until Bitcoin can reclaim this zone and actually stay above it, the bulls don't really have confirmation that momentum's shifting back in their favor.
⬤ If things go south, there's a cushion below. The chart shows a demand zone running from about $75,000 down to the low-$72,000s. That's where buyers might step in if the trendline breaks. Below that, Fibonacci extensions point to $73,500 and $71,950 as potential landing spots if the selling picks up again.
⬤ What happens next with Bitcoin matters for the whole crypto market. A clean break above $81,000 would calm some nerves and suggest the worst of the correction is over. But if BTC keeps getting rejected at these levels, traders will stay nervous about more downside. Right now, it's stuck in no-man's-land between resistance and support—and the next few sessions should tell us which way this breaks.
 Peter Smith


