 Usman Salis

⬤ Bitcoin keeps sending mixed signals as bullish candlestick patterns just aren't turning into real price gains. The data shows bullish engulfing candles outnumber bearish ones by about three to one on BTC's daily chart. But here's the thing—Bitcoin hasn't been able to capitalize on this. Recent price action stays flat instead of confirming any bullish turnaround.
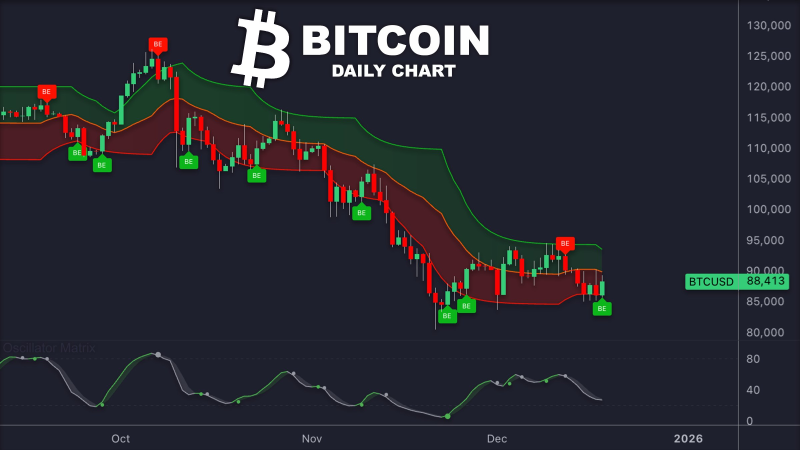
⬤ Looking at the daily chart, Bitcoin's hanging around $88,400, sitting near the bottom of its recent trading range. Price has been sliding down from earlier peaks near $120,000, creating a pattern of lower highs and lower lows. Sure, we've seen several bullish engulfing candles pop up during pullbacks, but they keep fizzling out without any real buying momentum behind them. That tells us selling pressure is still calling the shots.
⬤ The chart's volatility bands show Bitcoin trapped in a bearish structure, with every bounce getting shut down before hitting the upper band. Those bullish signals marked on the chart? They line up with brief price stabilization, not actual rallies. The momentum oscillator below reflects this back-and-forth action without showing any clear bullish divergence. Bottom line: just counting candles isn't enough to flip the trend.
⬤ This matters for the whole crypto market since Bitcoin usually sets the tone. When bullish patterns don't deliver upside movement, it points to deeper weakness or traders backing away from risk. Right now, there's a clear gap between what the candlestick stats suggest and what price is actually doing. Bitcoin's trading near important support levels, so how it reacts to the next signals could shake up short-term volatility and shape sentiment across the entire cryptocurrency space.
 Usman Salis


