 Usman Salis

⬤ Bitcoin is hovering near a crucial support trendline on the daily chart that's been holding since late November 2025. Trading around $88,000-$89,000 after a sustained pullback, BTC is sitting at a technically sensitive spot where things could go either way. The chart shows price squeezed between descending resistance above and rising support below, creating a tightening range that typically resolves with a stronger directional move.
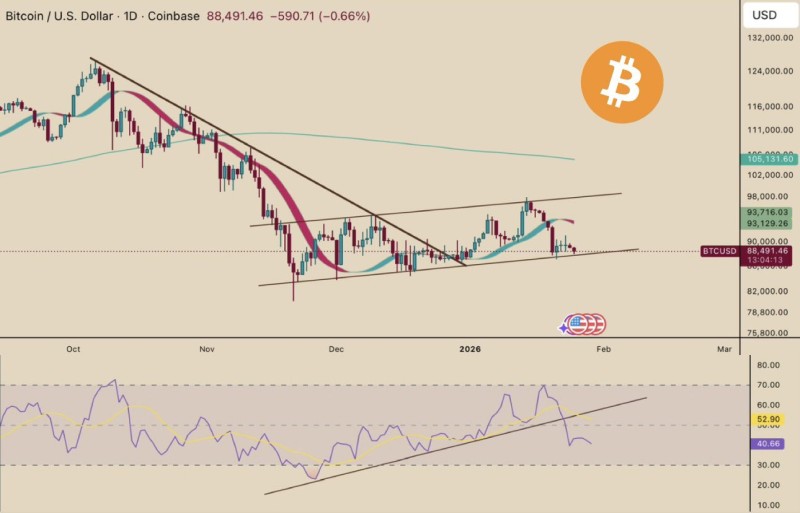
⬤ The technical picture isn't looking great for bulls right now. Recent daily candles show buyers aren't stepping up aggressively at these levels, which is concerning when you're testing major support. "The market may be entering a challenging phase if this trendline is lost," according to the analysis. While there's still a chance additional buying interest could show up here, the lack of strong bullish reactions suggests traders are more nervous than confident about defending current prices.
⬤ The $87,000 level is where things get critical. A clean break below this point would confirm the support trendline is broken and likely open the door to more downside as the market hunts for stronger buying zones. Momentum indicators are already rolling over, showing fading strength. Any bounces from here look more like corrections than the start of something bigger, especially with dip-buyers staying cautious instead of jumping in aggressively.
⬤ This setup matters because daily trendline breaks tend to trigger faster moves in the breakout direction. If Bitcoin can't hold above $87,000, the technical structure favors more downside ahead. On the flip side, holding this support could let BTC stabilize and work through the current range. With price at a make-or-break level and bulls sitting on their hands, the next few daily closes will likely determine whether we see another leg down or a defensive stand that buys some time.
 Usman Salis


