 Alex Dudov

⬤ Bitcoin is finding its footing after getting knocked down hard. Right now, it's stuck in a tight zone between $88,000 and $89,000 on the hourly chart. The interesting part? It's been making higher lows since the drop, which means buyers are stepping in rather than letting it fall further. The price action shows BTC trying to catch its breath in this narrow range, and traders are waiting to see which way it breaks.
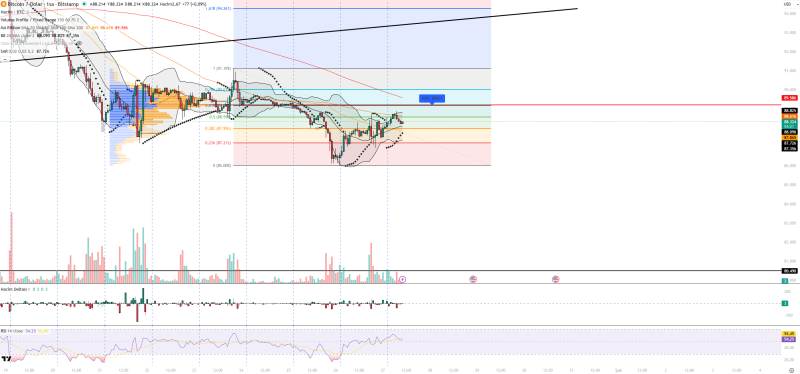
⬤ The technical picture shows Bitcoin in a holding pattern. The Relative Strength Index is sitting around 55 – basically neutral territory with some room to climb. Trading volume is pretty quiet, which tells us that neither buyers nor sellers are feeling particularly aggressive right now. The Volume Profile points to $89,200 as the key level where most of today's trading has happened – think of it as the current center of gravity for the price.
⬤ Other indicators back up this sideways story. Volume Delta shows no real buying pressure building up yet. Bollinger Bands have price hugging the middle line, which is typical when things are range-bound. The Parabolic SAR indicator sits below the current price, hinting at potential upside as long as support levels don't crack. On the downside, watch $88,520, $87,960, and $87,210. On the upside, resistance sits at $89,580, $90,000, and $91,100 – these levels form the boundaries of Bitcoin's current playground.
⬤ Why does this matter? Because these calm periods after big moves usually come before the next wave of volatility. The market is basically coiled up, waiting for something to trigger the next leg – whether that's ETF money flowing in, a shift in risk appetite across markets, or changes in the dollar's strength. Until trading volume picks up and confirms a direction, Bitcoin's behavior inside this $88K-$89K zone is what traders need to watch most closely.
 Alex Dudov


