 Alex Dudov

⬤ Bitcoin remains trapped under a long-term descending trendline on the 4-hour chart, holding the cryptocurrency in a narrow consolidation band. The price has been respecting this downward structure for months, unable to break through despite multiple attempts. Right now, BTC is hovering around the $87,000-$88,000 zone, still pressed against this technical ceiling.
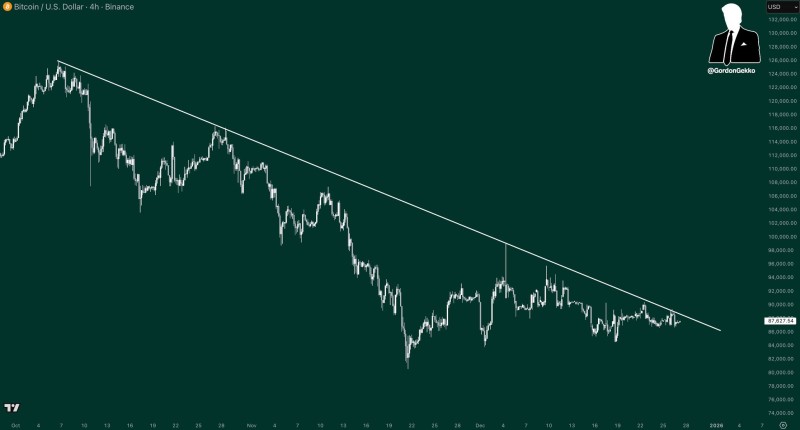
⬤ The chart shows a clear sequence of lower highs running from October through late December, all connecting along the same declining resistance line. Bitcoin keeps approaching this trendline only to get pushed back down, showing it hasn't built enough momentum to crack through. Each attempt to test the line ends in a pullback, keeping the broader trend locked in a downward channel. The recent price action is compressed tightly beneath this barrier, with candles clustering in a small range as the market waits for direction.
⬤ The setup has been described as "a beachball being held underwater"—pressure building while Bitcoin stays pinned below resistance. These compression phases often come right before bigger directional moves once the pattern finally resolves. For now though, BTC continues grinding sideways under the trendline with no clear breakout in sight. The descending line remains the key reference point traders are watching.
⬤ How Bitcoin behaves around major resistance like this tends to set the tone for the entire crypto market. The ongoing consolidation signals indecision and caution—nobody's sure which way this breaks yet. A sustained move above the trendline would flip the narrative completely, but until that happens, Bitcoin stays technically boxed in. Traders are locked in, watching to see if BTC keeps chopping sideways or finally builds enough strength to push beyond this long-standing resistance.
 Alex Dudov


