 Usman Salis

⬤ Bitcoin is showing signs of a classic Adam and Eve bullish reversal pattern, with the price rounding upward toward a major resistance zone on the chart. The setup follows the textbook formation—a sharp V-shaped drop (the "Adam" side) followed by a gentler, rounded bottom (the "Eve" side), with both meeting at a neckline that acts as the breakout point. Right now, BTC is trading just below this resistance band, putting it at a make-or-break technical moment.
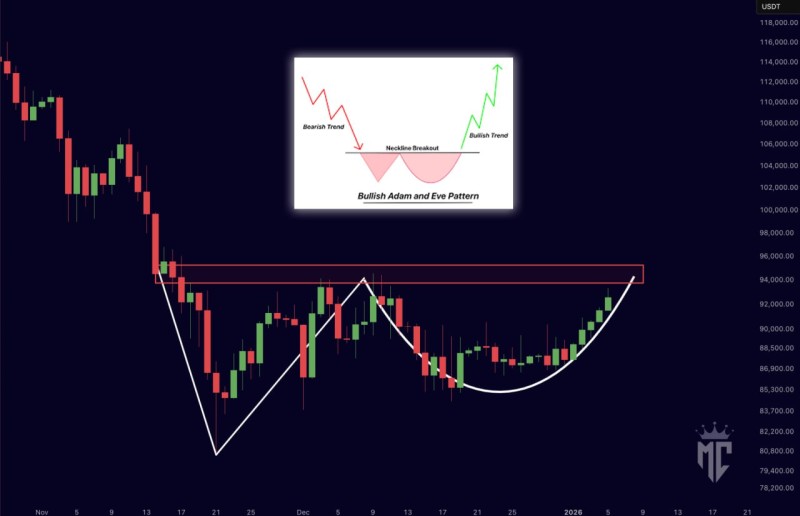
⬤ The chart clearly shows the neckline sitting near the upper edge of the trading range, with multiple previous candle rejections at the same spot, which confirms how important this level really is. The Adam portion features that steep plunge and quick bounce, while the Eve side shows a slower, smoother recovery that's been pushing BTC higher over time. The drawn curves on the chart map out this market structure perfectly, matching what technical analysts look for in a proper Adam and Eve double bottom.
⬤ Looking at the bigger picture, Bitcoin's momentum has clearly shifted from the earlier downtrend into more stable price action as the rounded right side of the pattern developed. This has created a series of higher daily closes leading right up to the resistance area. The diagram included in the chart shows how this pattern typically plays out once the neckline breaks—flipping from bearish conditions into a fresh bullish trend as soon as price clears that horizontal level.
⬤ This developing formation matters because Adam and Eve patterns carry a lot of weight in crypto markets, especially when they show up at major resistance lines. If BTC pushes through the neckline, it could trigger renewed bullish momentum and boost market confidence. But if it gets rejected here, it means Bitcoin is still stuck under selling pressure. With BTC sitting right at this technical crossroads, how it reacts at this resistance zone will likely set the tone for near-term trading across the crypto market.
 Usman Salis


