Usman Salis

⬤ Bitcoin posted a short-term bounce after steep losses, but the rally looks fragile. Price found some buying interest in the $89K–$90K zone following a sharp sell-off. While buyers stepped in at lower levels and triggered a recovery attempt, the hourly chart shows BTC still trading inside a descending channel—meaning the broader trend remains bearish despite the rebound.
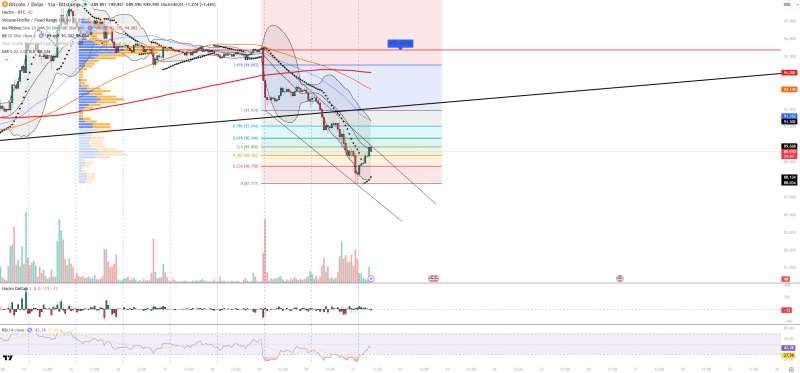
⬤ Momentum indicators aren't showing much conviction behind this bounce. RSI sits around 42, pointing to weak underlying strength even as it climbs from oversold levels. Price rebounded from the lower Bollinger Band—a classic sign of a technical correction within a downtrend rather than a reversal. The Parabolic SAR still sits above price, showing selling pressure hasn't fully let up. Rising volume during the bounce suggests reactive buying rather than confident accumulation.
⬤ Key resistance levels are stacking up above current price. The Volume Profile Point of Control near $93,660 stands out as major resistance, lining up with the upper boundary of the descending structure. Additional barriers appear around $90,350, $91,300, and $93,150. Support zones cluster near $89,600, $89,350, and $88,750. Fibonacci retracement levels confirm the recent move fits a corrective pattern rather than a structural shift.
⬤ Macro conditions continue weighing on Bitcoin's short-term outlook. Weakness in global risk appetite and volatility tied to Nasdaq-linked assets are adding pressure. Bitcoin's currently behaving more like a risk-sensitive asset than a defensive one. Upcoming US economic data and interest rate expectations will likely determine whether BTC stabilizes here or resumes its slide in the sessions ahead.
 Usman Salis