 Marina Lyubimova

Cardano (ADA) is currently trading within a tightening symmetrical triangle pattern that's been developing throughout 2025. Technical indicators point to the $0.69 support level as a potentially significant accumulation zone before a possible rally toward $2. This analysis examines the current setup and what traders should watch for in the coming weeks.
Technical Pattern Analysis
ADA has been consolidating inside a symmetrical triangle on the 12-hour chart, with price action steadily narrowing between converging support and resistance lines. The recent rejection near $0.95 resistance combined with solid support around $0.69 creates a textbook setup that often precedes directional moves.
Analyst Ali recently highlighted this pattern, noting that the consolidation phase appears to be nearing completion. The chart shows three key levels traders are watching:
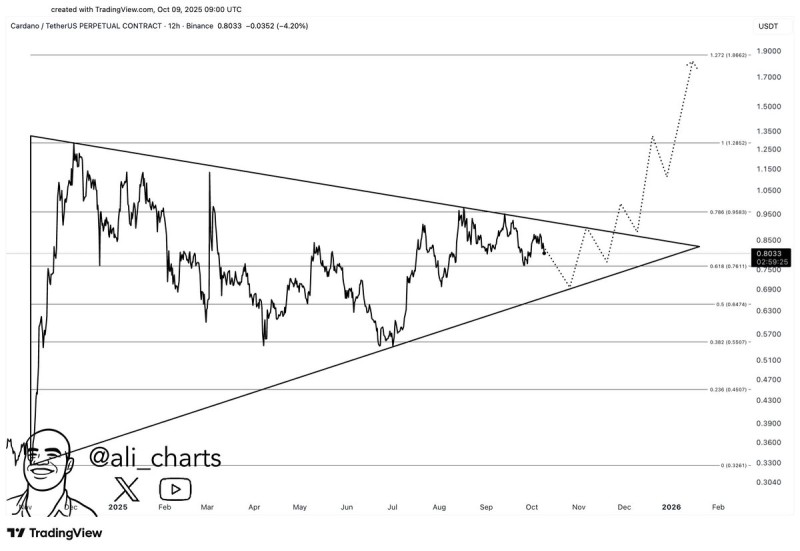
- Support zone: $0.69–$0.76
- Resistance levels: $0.95 and $1.28 (Fibonacci retracement)
- Breakout target: $1.86 (Fibonacci extension)
The technical projection suggests ADA may test the lower support boundary one final time before attempting a breakout to the upside. If this scenario plays out, the $0.69 level would represent the last significant dip before higher prices.
Factors Supporting a Bullish Case
Beyond the technical setup, several fundamental elements support the possibility of an ADA rally. Cardano's ecosystem continues expanding with steady growth in DeFi protocols, NFT projects, and decentralized applications. The network maintains strong developer activity and community engagement despite broader market volatility.
Long-term holders remain committed to ADA, with the asset consistently ranking among the most widely held cryptocurrencies. Recent shifts in broader altcoin sentiment have also created conditions that could fuel breakouts across quality projects like Cardano.
If the $0.69 support zone holds during any potential retest, technical patterns suggest ADA could first target the $1.28 resistance level. A clean break above that point would open the door toward $1.86 and potentially the psychological $2 milestone. However, a breakdown below $0.69 would invalidate this bullish structure and likely lead to deeper consolidation.
The symmetrical triangle pattern typically resolves within its final third, meaning a decisive move could occur relatively soon. Traders should watch volume closely, as breakouts accompanied by strong volume tend to be more reliable than low-volume moves.
For now, the $0.69 level remains the critical zone that could define ADA's next major move.
 Marina Lyubimova


