Saad Ullah

Cardano is flashing multiple reversal signals on its higher timeframe chart. According to TheCryptoBasic, the price structure suggests that a prolonged downtrend may be transitioning into a new phase - with key formations historically associated with major trend shifts and significant upside potential.
Cardano Double Bottom Signals a Structural Change
The chart reflects a higher-timeframe double bottom, where price has tested a similar low region multiple times without breaking down further.
This pattern is widely considered a classic reversal formation, indicating that selling pressure is being absorbed at these levels.
The repeated defense of this lower zone suggests the market is forming a base that can act as a foundation for a larger upward move if confirmed.
The strength of this setup lies in its consistency. Each failed breakdown reinforces the idea that buyers are stepping in at these levels, gradually shifting the balance of power. You can see how this dynamic plays out in more detail in ADA Holds $0.24-$0.26 Support Zone as Multi-Year Level Comes Into Focus, which explores how repeated support validation can underpin larger breakout scenarios.
ADA Falling Wedge Points to an Imminent Breakout
Beyond the base formation, the chart shows a falling wedge pattern where price is compressing within downward-sloping boundaries. This structure typically reflects weakening bearish momentum and often precedes a breakout to the upside.
The narrowing range indicates that volatility is contracting, bringing price closer to a decision point. Once that compression resolves, the move that follows tends to be sharp.
A breakout from this wedge would mark a shift from compression into expansion - and that transition is exactly what the current setup is building toward.
Similar structural setups have been analyzed in ADA Builds a Massive Multi-Year Base as MACD Signals Potential Breakout, where long-term accumulation periods are shown to precede significant directional moves.
ADA Price Projection Extends Toward $5
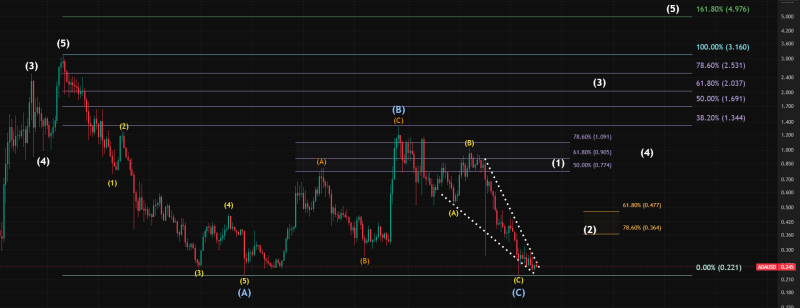
The combination of these two signals - the double bottom and the falling wedge - creates a setup that supports a significantly higher price trajectory if confirmed. The projection highlighted on the chart points toward the $5 level, representing a substantial upside expansion from current prices.
This aligns with the broader technical structure, where a confirmed breakout could trigger a sustained trend reversal rather than just a short-term bounce.
Key factors supporting the bullish case:
- Higher-timeframe double bottom forming after prolonged downside pressure
- Falling wedge compression pointing to a breakout decision point
- $5 price target derived from the combined pattern projection
- Repeated defense of the base zone reinforcing buyer commitment
For broader context on how this reversal structure has been developing, Cardano Approaches Key Reversal Zone outlines how these formations begin to emerge after extended periods of downside pressure - and what confirmation would look like.
 Saad Ullah