Peter Smith

⬤ Stellar (XLM) is hanging around $0.15 after dropping hard from its cycle peak near $0.93, putting the spotlight back on long-term support levels. XLM trading at $0.15 with a critical support zone between $0.145-$0.136, while the first recovery area sits at $0.16-$0.165. The chart confirms this picture, showing XLM/USD at $0.150690 with the cycle high marked at 0.930921 and low at 0.001464, highlighting just how deep this pullback has gone.
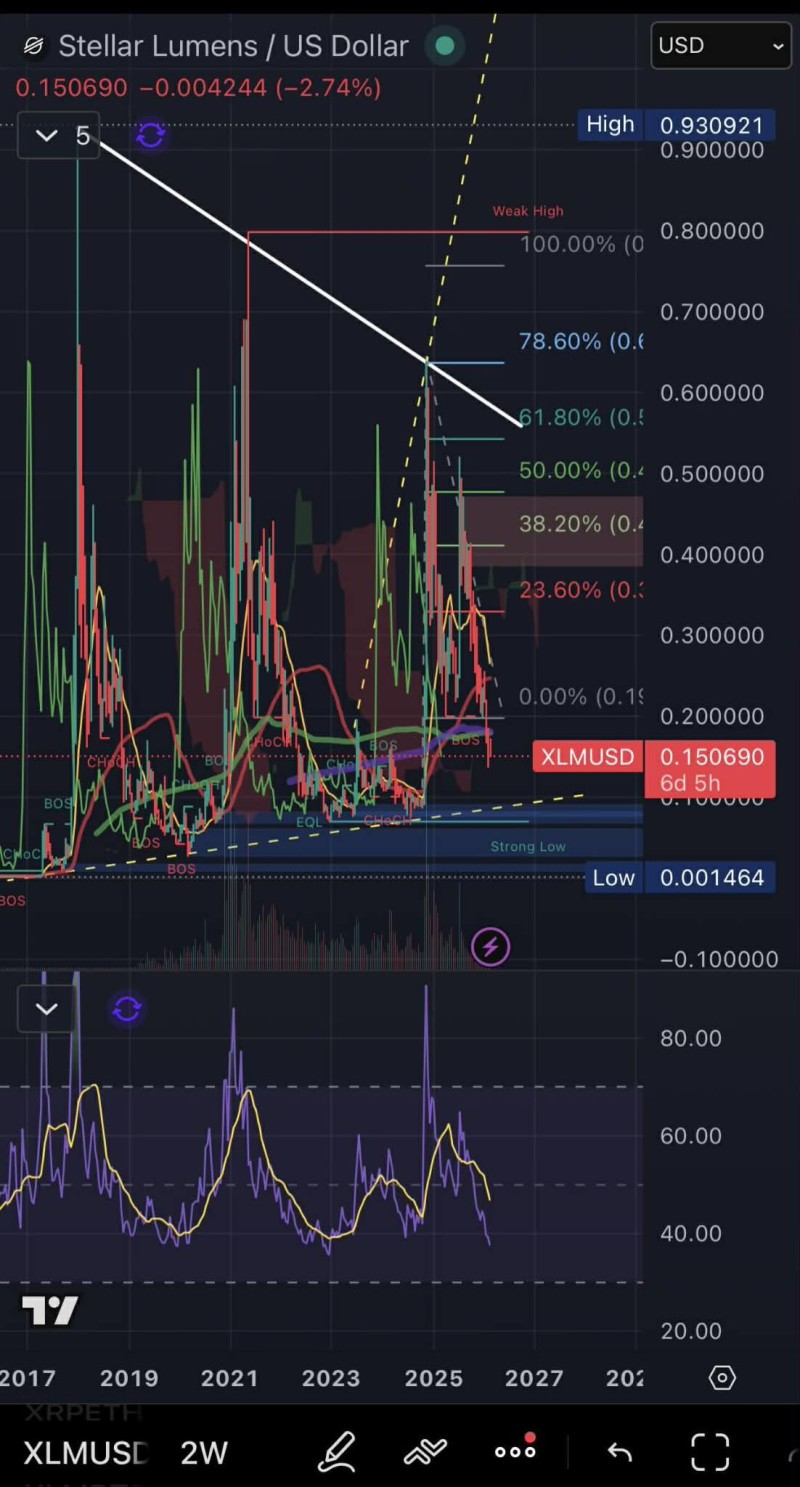
⬤ Fibonacci retracement levels from the previous high show key bands at 23.6%, 38.2%, 50%, 61.8%, and 78.6% above current price. With XLM sitting well below these higher zones, the market remains in a depressed section of the broader range. Stellar Targets $0.34 Rebound After Stabilizing Near $0.25 examined similar multi-month decision zones and recovery scenarios. The nearby support band becomes the key reference point right now, with a reclaim of $0.16-$0.165 representing the first step toward rebuilding momentum.
⬤ "This could be a shakeout zone before the next leg up," according to the analyst's projection, which outlines upside targets like $0.25-$0.30 sitting in the chart's mid-range resistance territory. However, these scenarios depend entirely on support holding and price reclaiming those key levels first. The chart really drives home how volatile XLM's historical range has been, which is why traders typically wait for confirmation signals around reclaim zones instead of betting on immediate reversals.
⬤ Right now, XLM sits at a price point where nearby support and reclaim levels can seriously influence short-term direction. If the $0.136 line holds, it strengthens the case for building a base. If it breaks, the chart suggests renewed downside risk. 6-Year Correction Approaches $0.079-$0.163 Decision Zone provide additional context on how Stellar behaves around major make-or-break levels during longer corrective phases.
 Peter Smith