 Saad Ullah
The European Union's services trade with the rest of the world reached a staggering €3.47 trillion in 2024, according to fresh data from Eurostat. The figures don't just show how much the EU spends on imported services - they reveal how differently each member state sources them, and which countries rely most heavily on digital and remote delivery versus physical presence on the ground.
Eurostat breaks down services imports using a "mode of supply" framework with four categories: cross-border supply (mode 1), consumption abroad (mode 2), commercial presence (mode 3), and presence of natural persons (mode 4). Among all EU members, Greece recorded the highest share of cross-border supply at 68.8% of its total extra-EU services imports. Cyprus followed at 43.8%. On the opposite end, Hungary and Croatia reported the lowest mode 1 shares - just 13.6% and 14.0% respectively.
By illustrating how services are sourced from outside the EU, the latest Eurostat release provides additional context for understanding the bloc's external economic exposure.
As EU Unemployment Holds at 6.0% in September and other recent Eurostat releases have shown, structural economic differences across member states consistently shape how the bloc engages with global markets - and services trade is no exception.
Commercial Presence Dominates for Most EU Countries
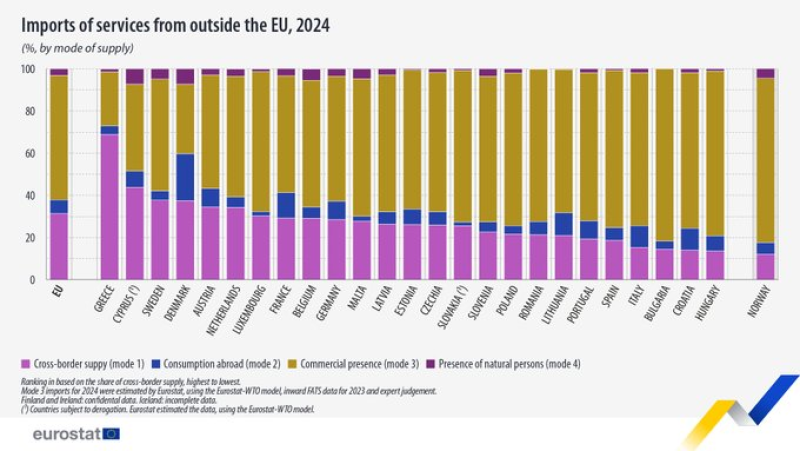
For many member states, mode 3 - commercial presence - makes up the largest portion of services imports. In practical terms, this means foreign companies set up local subsidiaries or branches inside the EU to deliver their services, rather than supplying them remotely. This model tends to dominate in economies with larger domestic markets and stronger foreign direct investment inflows.
Cross-border supply, consumption abroad, and the presence of natural persons account for smaller but still meaningful shares, depending on each country's economic structure and trade relationships. The €3.47 trillion headline figure puts the scale of the EU's global services integration into clear perspective - and raises ongoing questions about regulatory exposure, digital trade policy, and economic dependency on external providers.
For broader context on EU economic performance, see EU GDP Data: Agriculture Equals 1.2% in 2024 as Greece Leads and Dublin Tops EU GDP Rankings, Mayotte Ranks Last.
 Saad Ullah


