 Artem Voloskovets

⬤ Gold has entered a completely new technical phase after smashing through resistance that held for decades on the monthly chart. The pattern that just completed is a massive cup-and-handle formation that's been building since the early 2000s. What makes this breakout particularly noteworthy is how cleanly price pushed through that upper boundary after years of consolidation. The shift from sideways grinding to rapid acceleration happened fast once resistance finally gave way.
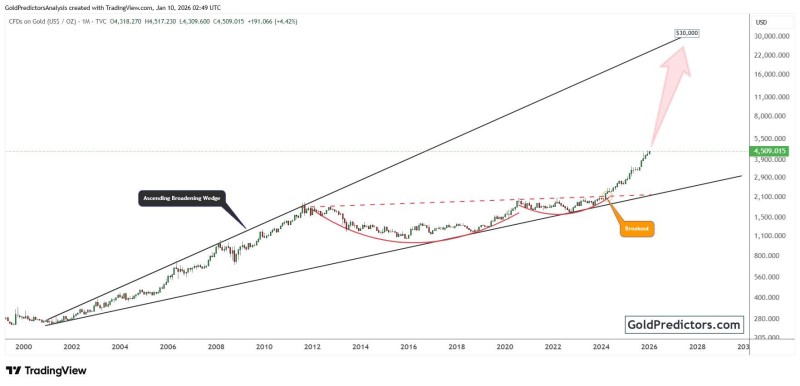
⬤ Looking at the bigger picture, gold spent more than twenty years trading inside this ascending structure, consistently respecting both rising support and resistance lines. After hitting peaks in the early 2010s, the market entered a long consolidation that formed the rounded bottom of the cup. Then came the handle phase, where price moved sideways just beneath resistance for several years, building pressure. The breakout happened when gold decisively cleared this resistance zone, finishing off a pattern that took decades to form.
⬤ Once the breakout confirmed, gold didn't just edge higher—it accelerated hard, climbing well past previous cycle highs and reaching the $4,500 area. This wasn't some brief spike that faded quickly. The move represents a genuine extension of the broader trend, with price now operating in territory that was resistance for years. The scale of this completed pattern suggests there's room for further upside, though exactly when and how far remains to be seen.
⬤ Why this matters beyond gold itself: multi-decade technical patterns like this don't just affect one asset—they ripple through entire markets. When gold makes a move of this magnitude after such a long setup, it influences sentiment across commodities, currencies, and risk assets. XAU is now trading in price territory it's never seen before relative to past cycles. How it behaves from here could shape volatility patterns, momentum flows, and longer-term market narratives across the board.
 Artem Voloskovets


