 Marina Lyubimova

Crude oil has entered a decisive phase after a powerful breakout pushed prices into a historically significant resistance zone. As James Stanley noted, the $120 level represents the 161.8% Fibonacci extension of the 2023-2025 move - placing the market at a key technical threshold with limited resistance beyond it.
The WTI Extension Level Defining the Oil Move
The chart clearly marks the $120 area as a 1.618 Fibonacci extension, aligning with the upper boundary of the current rally. This level is not arbitrary - it represents a mathematically derived projection from the prior cycle, often acting as a major reaction point.
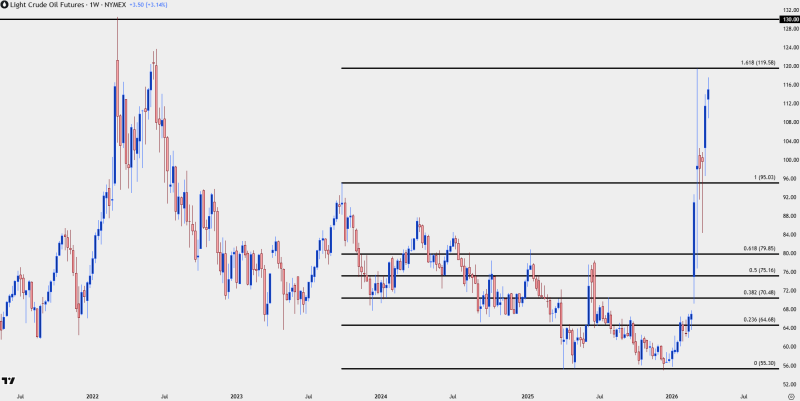
Price has surged into this zone following a sharp upward expansion from the mid-$60 region, where crude had previously based. The move through intermediate levels such as $75, $80, and $95 occurred with strong momentum and left little evidence of sustained resistance along the way.
That kind of structure reflects a trend transition rather than a gradual climb - buyers maintained control throughout the advance with pullbacks remaining shallow and short-lived.
USOIL Price Analysis: Crude Oil Eyes $110-$120 Resistance After Strongest Weekly Surge captured the momentum building into this zone, showing how the weekly surge that preceded the current test was itself a historically notable move.
From WTI Compression to Vertical Expansion
Before the breakout, oil spent extended time consolidating between roughly $55 and $80. This range-bound behavior created a base that eventually resolved decisively higher. Once price cleared the upper boundary of that range, the structure shifted:
- Resistance levels were breached in quick succession
- Pullbacks became shallow and short-lived
- Momentum accelerated as price entered higher zones
This transition from consolidation to expansion is a defining feature of strong bullish trends. WTI Oil Price Analysis: Crude Breaks $65.39, Eyes $68-$69 Level documented the early breakout phase when oil was still working through the lower end of that range - providing a baseline for how far the structure has traveled since then.
The Narrow WTI Path Between $120 and $130
The significance of the current zone lies in what comes next. Once above $120, the chart shows limited historical reference until the $130 area - last seen briefly during the 2022 spike. This creates a compressed resistance corridor with specific implications:
- $120 acts as the immediate barrier tied to the Fibonacci extension
- Above it, the next major reference sits near $130
- The lack of intermediate resistance increases the potential for accelerated movement
Such structures often lead to fast price discovery when broken - fewer historical levels exist to slow momentum between $120 and $130.
WTI Crude Oil Crashes 12% After Strategic Reserve Shock serves as a reminder of how quickly policy intervention can disrupt technical momentum - a risk that remains relevant as oil presses into politically sensitive territory above $120.
Extension levels like 1.618 frequently act as either continuation triggers or exhaustion points depending on how price behaves upon contact. So far, the trend remains intact with no clear lower highs or breakdown signals visible on the chart. For now, crude oil is pressing into a zone where historical extremes and technical projections converge - and where the next move is likely to define the broader structure for weeks ahead.
 Marina Lyubimova


