Victoria Bazir
Oil markets are moving sharply higher, with WTI crude reaching approximately $114 - its highest level since mid-2022. Analyst Carl Hawley, who noted that the rally coincides with rising U.S.-Iran tensions, points out that from a technical standpoint the structure was already primed for expansion before the latest push. The chart reflects a powerful bullish move, with price accelerating after a prolonged base and pushing into a key historical zone.
WTI Oil Breaks Range and Launches Into Uptrend
The chart shows a clear transition from consolidation into a strong impulsive uptrend. Price spent time stabilizing near the mid-$60 region before launching into a sustained rally marked by consecutive bullish candles. This breakout phase is defined by minimal pullbacks and strong continuation structure, with each push higher building on the previous one.
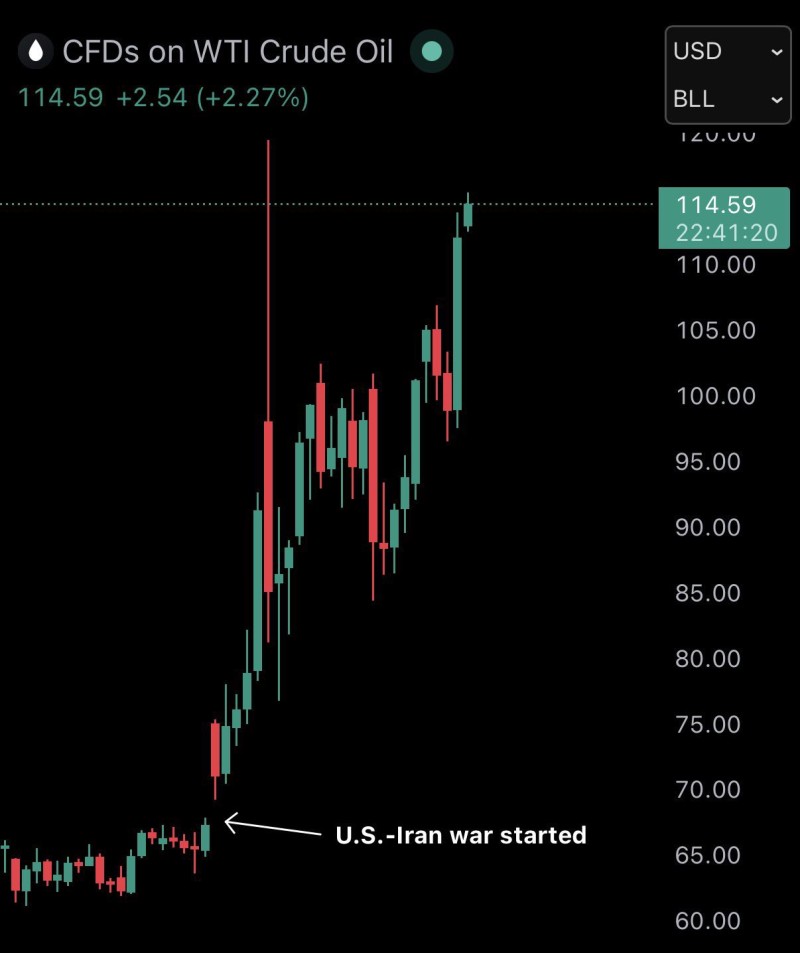
The move above the $100 level acted as a structural shift, turning prior resistance into a launching point for further upside. Traders watching Oil Hits Highest Weekly Close Since 2022 as Crude Tests $112 Resistance have been tracking exactly this kind of setup as crude pushed through major levels in quick succession.
WTI Oil Surges From $100 to $114 in Near-Vertical Climb
The latest leg higher stands out for its steepness. Price has surged from below $100 to above $114 in a relatively short time, forming a near-vertical climb. This kind of structure reflects aggressive buying pressure and a lack of meaningful resistance during the advance.
However, the chart also shows signs of volatility - including a sharp rejection wick earlier in the move. That indicates that while buyers are dominant, the market is not moving in a smooth, controlled trend. Broader commodity markets are reflecting similar dynamics, with Gold (XAU) Surges as Market Risk Aversion Intensifies pointing to a wider flight into hard assets across the board.
WTI Oil Tests Critical Resistance Zone From the 2022 Cycle
Price is now testing an area that previously acted as a ceiling during the 2022 cycle. The key detail is how price arrived at this level. Unlike prior attempts, the current move shows strong momentum and very little consolidation beneath resistance - that changes the dynamic of the test, making either a breakout or a sharp reaction more likely.
Analysts covering related markets have flagged similar dynamics, with Gold (XAU) Price News: Bearish Divergence Signals Potential Pullback highlighting how momentum extremes across commodities are beginning to show early warning signs worth monitoring.
Price is now testing an area that previously acted as a ceiling during the 2022 cycle - unlike prior attempts, the current move shows strong momentum and very little consolidation beneath resistance.
For now, the trend remains firmly upward, but the pace of the move suggests the market is entering a more reactive phase - where structure, not just momentum, will determine what comes next.
 Victoria Bazir